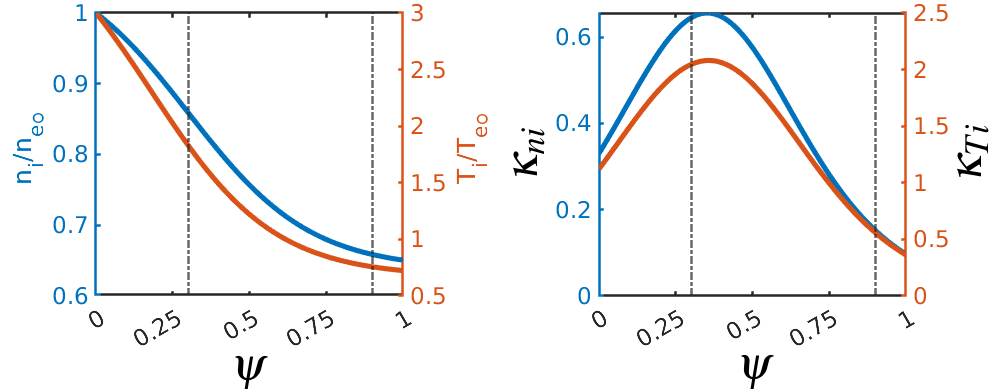
profile.in
Sample file: profile.in
MATLAB script to read “profile.in” and visualize the data:
- "ReadProfile.m"
function Data = ReadProfile(FileName)

%-------------------------------------------------------

P = readcell(FileName);

L = length( P(:,1) );

for i = 2 : L
    if( ~isnumeric( P{i,1} ) )
        break;
    end
end

lsp = i-2;

Data = zeros(lsp,15);

for i = 1 : lsp
    for j = 1 : 15
        Data(i,j) = P{i+1,j};
    end
end

return
MATHEMATICA file to tune the cyclone-profile parameters: Cyclone.nb
MATLAB file to generate a cyclone (analytic) profile:

- generate_profile.m
close all
clear
clc

%----------------------------------------
%----- Data from gtc.in file ------------

ne = [ 0.205 , 0.30 , 0.4 ];  % Cyclone base case, R0/L_ne = 2.2 (Lin 2007)
te = [ 0.415 , 0.18 , 0.4 ];  %                    R0/L_te = 6.9
ti = [ 0.415 , 0.18 , 0.4 ];

lsp = 250;

%--------------------------------------------------------------------
%
%      nepp(1,i)=1.0_lk+ne(1)*(tanh((ne(2)-pdum)/ne(3))-1.0_lk)
%      tepp(1,i)=1.0_lk+te(1)*(tanh((te(2)-pdum)/te(3))-1.0_lk)
%      tipp(1,i)=1.0_lk+ti(1)*(tanh((ti(2)-pdum)/ti(3))-1.0_lk)
%
%--------------------------------------------------------------------

psiw = 2.34196261E-02; %0.0375;

spdpsi = psiw / (lsp-1);

psi = zeros(lsp,1);

nepp = zeros(lsp,1);
tepp = zeros(lsp,1);
tipp = zeros(lsp,1);

%--------------------------------------------------------------------

%ne(2) = 0.5;

for i = 1 : lsp
    pdum=spdpsi*(i-1)/psiw;

    psi(i) = pdum;

    nepp(i) = 1 + ne(1) * (tanh( (ne(2)-pdum)/ne(3) ) - 1 );
    tepp(i) = 1 + te(1) * (tanh( (te(2)-pdum)/te(3) ) - 1 );
    tipp(i) = 1 + ti(1) * (tanh( (ti(2)-pdum)/ti(3) ) - 1 );
end

nepp = 3.5 * 10^13 * nepp;
tepp = 2300 * tepp;
tipp = 6500 * tipp;

%---------------------------------------------------------------------

figure;
subplot(2,1,2);
plot( psi , nepp/nepp(1) );
title('ne');

%----------------

subplot(2,1,1);
dne = conv( log(nepp) , [1,-1] , 'same' ) / spdpsi;
dne(end) = dne(end-1);
plot( psi , -dne );
title('-dlnne/dpsi');

sgtitle('Normalized data');

%---------------------------

figure;
subplot(2,1,2);
plot( psi , tepp/tepp(1) );
title('Te');

%----------------

subplot(2,1,1);
dte = conv( log(tepp) , [1,-1] , 'same' ) / spdpsi;
dte(end) = dte(end-1);
plot( psi , -dte );
title('-dlnTe/dpsi');

sgtitle('Normalized data');

%----------------------------

figure;
subplot(2,1,2);
plot( psi , tipp/tipp(1) );
title('Ti');

%----------------

subplot(2,1,1);
dti = conv( log(tipp) , [1,-1] , 'same' ) / spdpsi;
dti(end) = dti(end-1);
plot( psi , -dti );
title('-dlnTi/dpsi');

sgtitle('Normalized data');

%--------------------------------------------------------------------

fID = fopen("profile.in","w");

fprintf(fID,'   Pol-Flux            x              r              R               R+r             Te              ne              Ti            Zeff          omega-tor           Er              ni           nimp             nf              Tf\n');

for i = 1 : lsp
    fprintf( fID , '   %1.7e   %1.7e   %1.7e   %1.7e   %1.7e   %1.7e   %1.7e   %1.7e   %1.7e   %1.7e   %1.7e   %1.7e   %1.7e   %1.7e   %1.7e\n' ,...
        psi(i) , 0 , 0 , 0 , 0 , tepp(i) , nepp(i) , tipp(i) , 0 , 0 , 0 , 0 , 0 , 0 , 0 );
end

fclose(fID);

%--------------------------------------------------------------------

figure;
subplot(1,2,1);
plot(psi,nepp);
title('nepp');

subplot(1,2,2);
plot(psi,tipp);
hold on
plot(psi,tepp);
legend('tipp','tepp');

sgtitle('Raw data')