Mass models
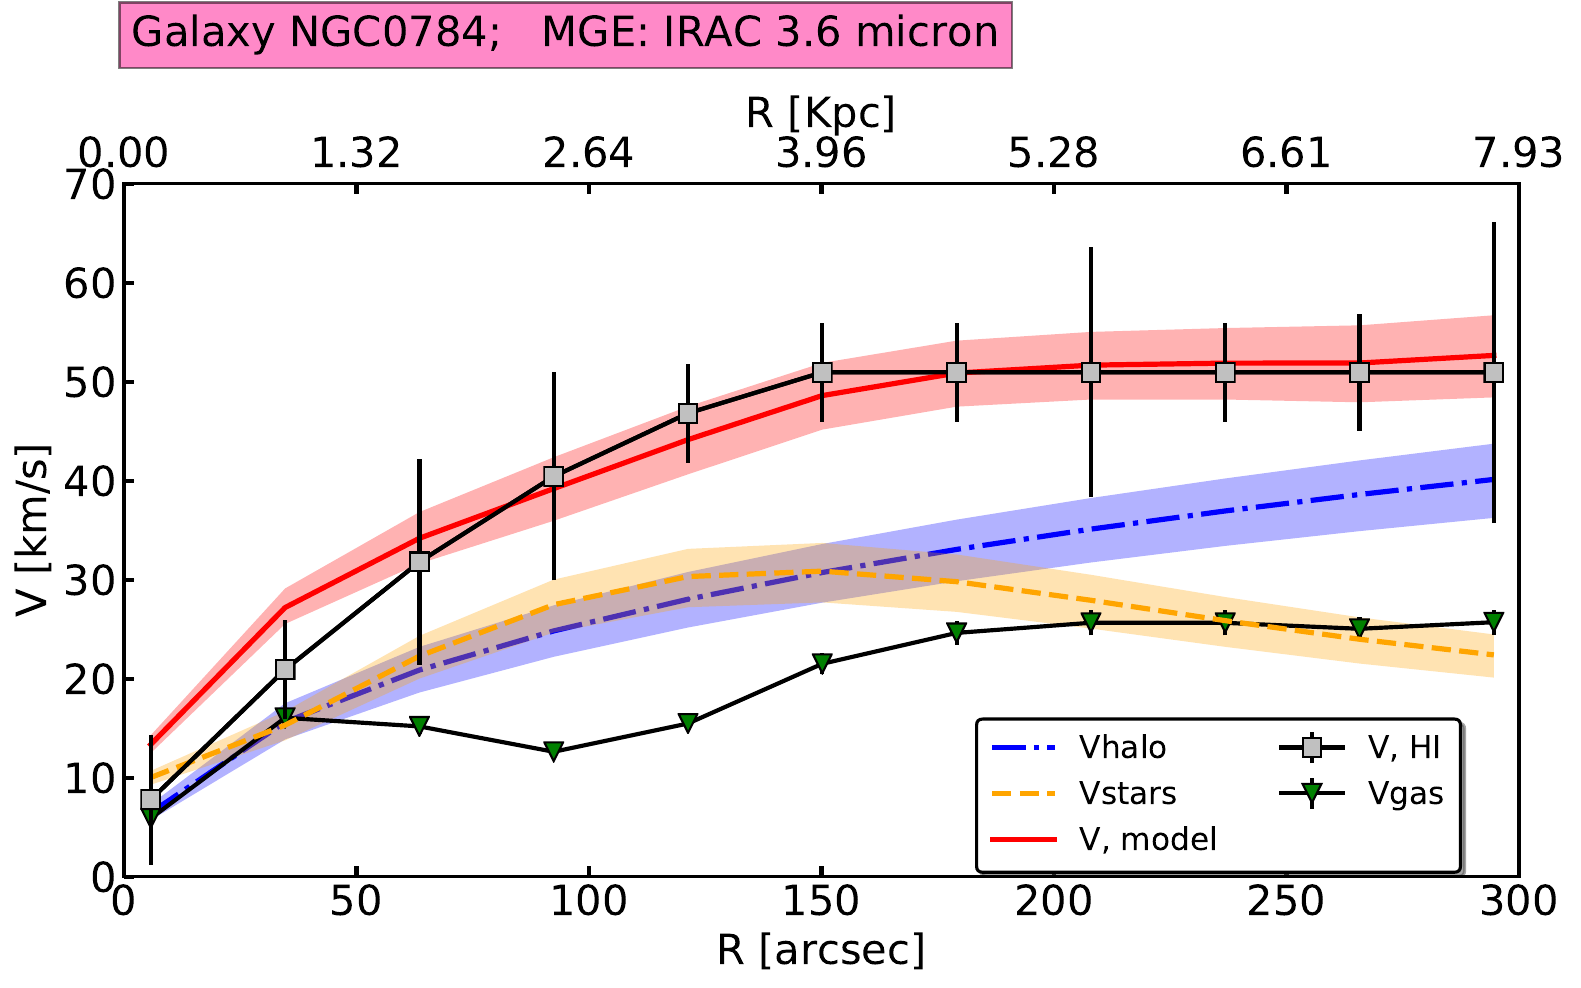
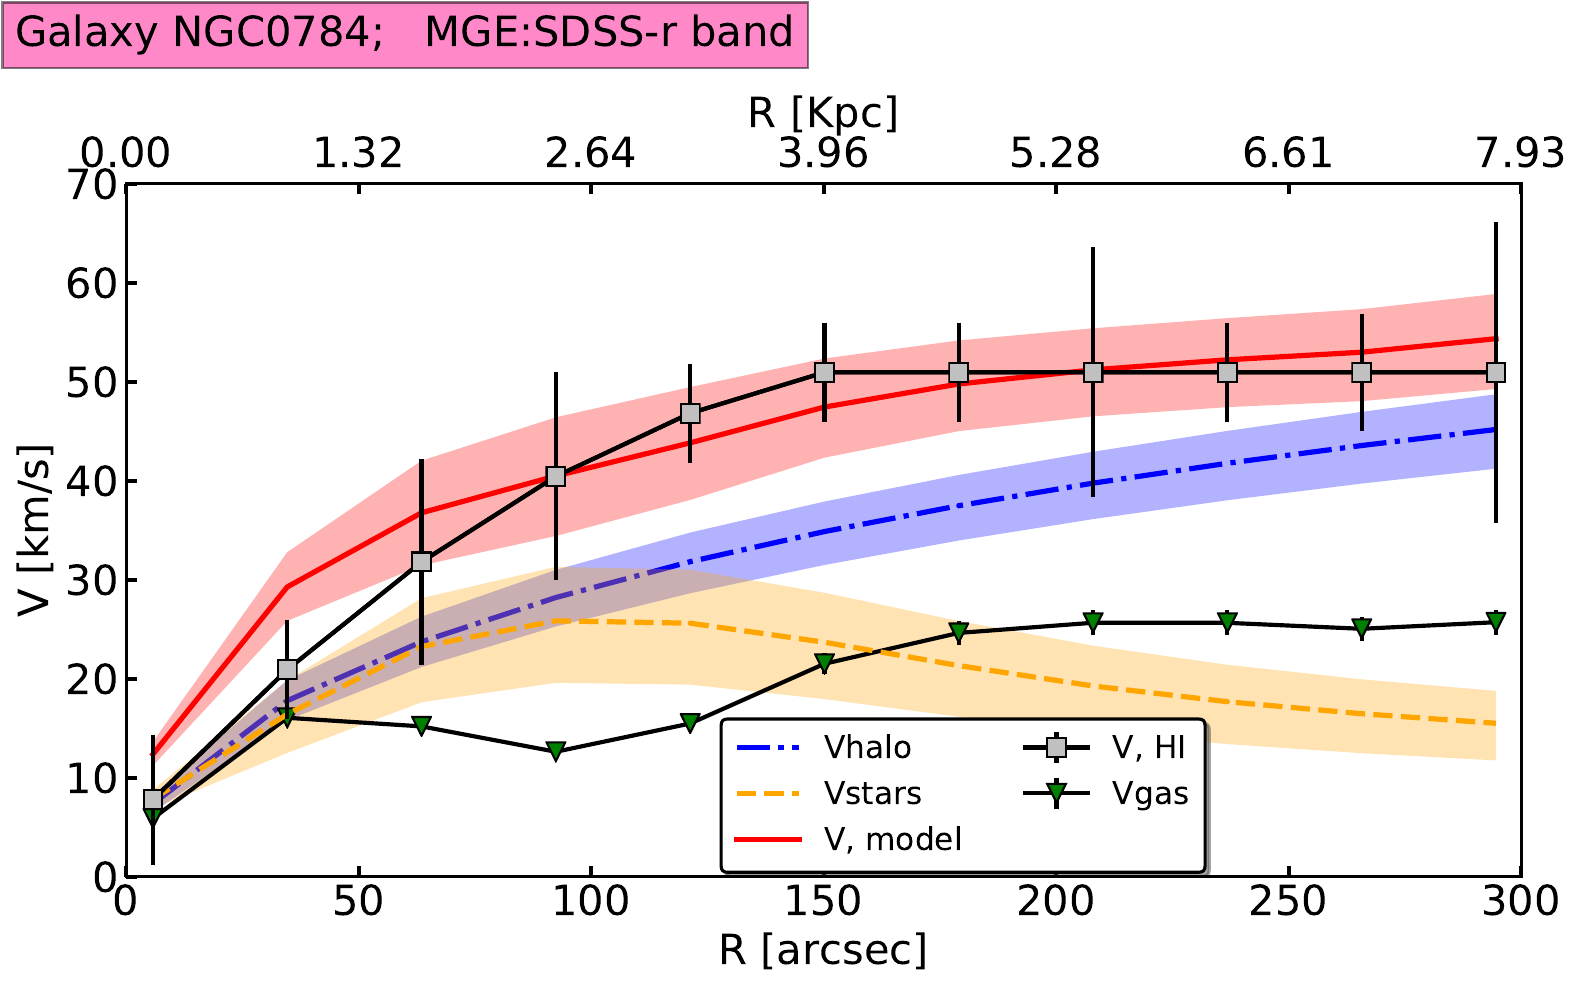
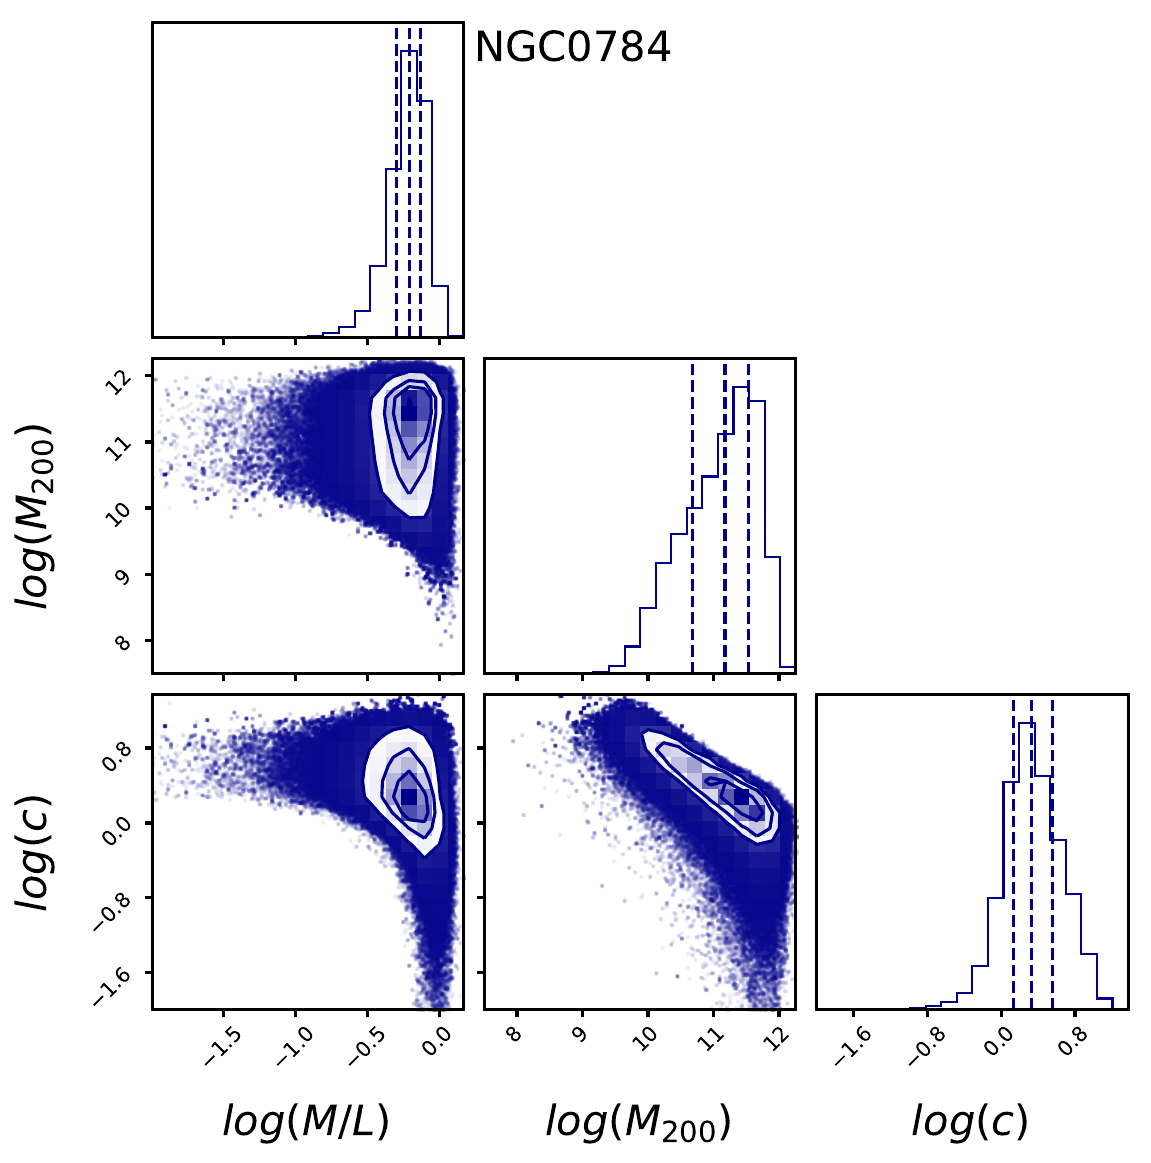
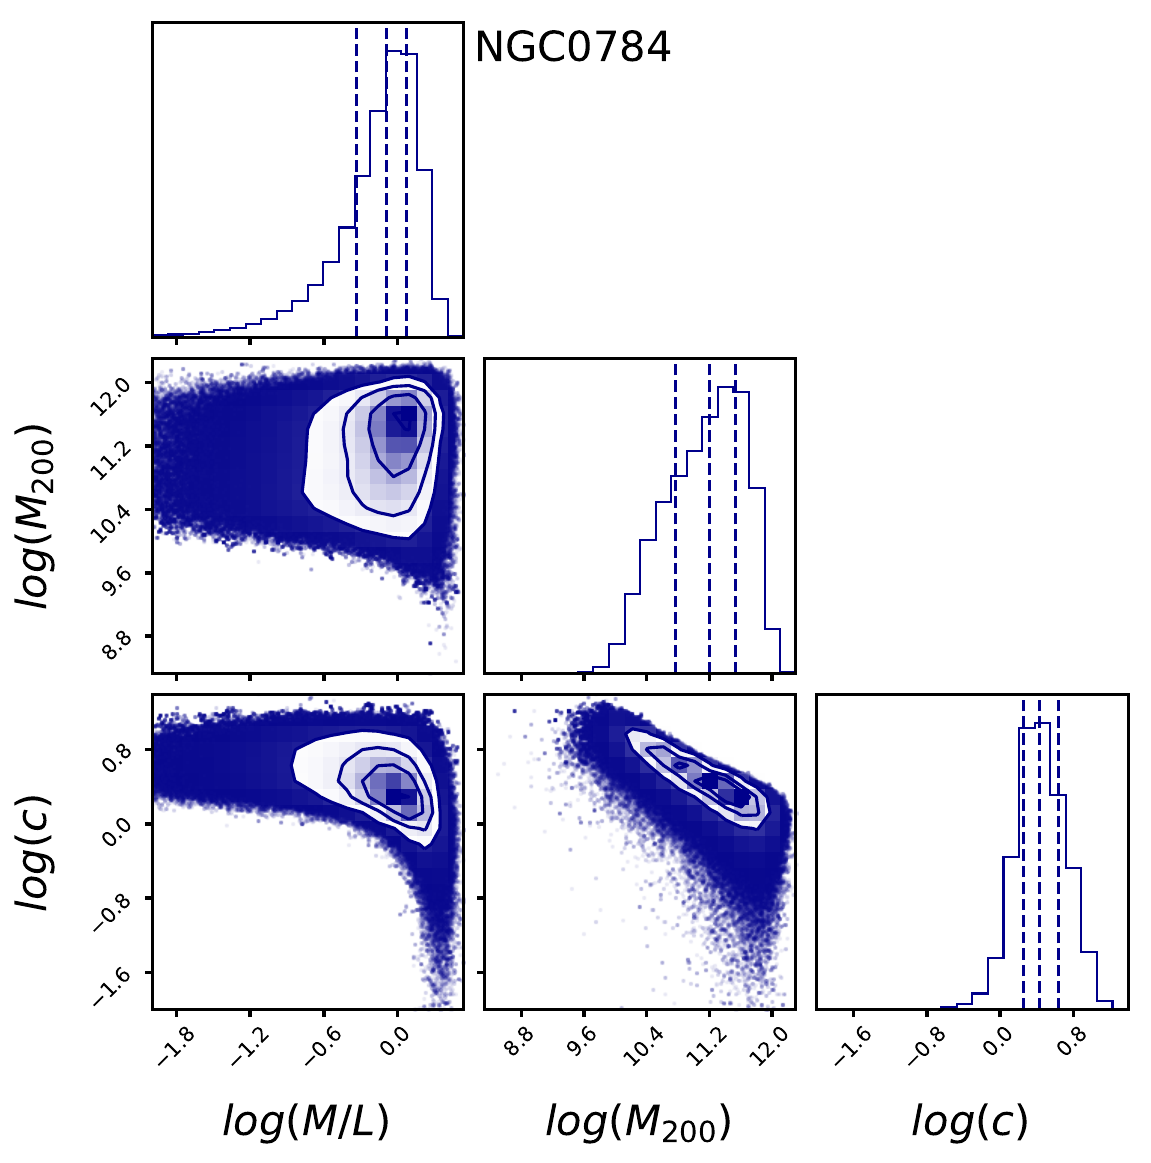
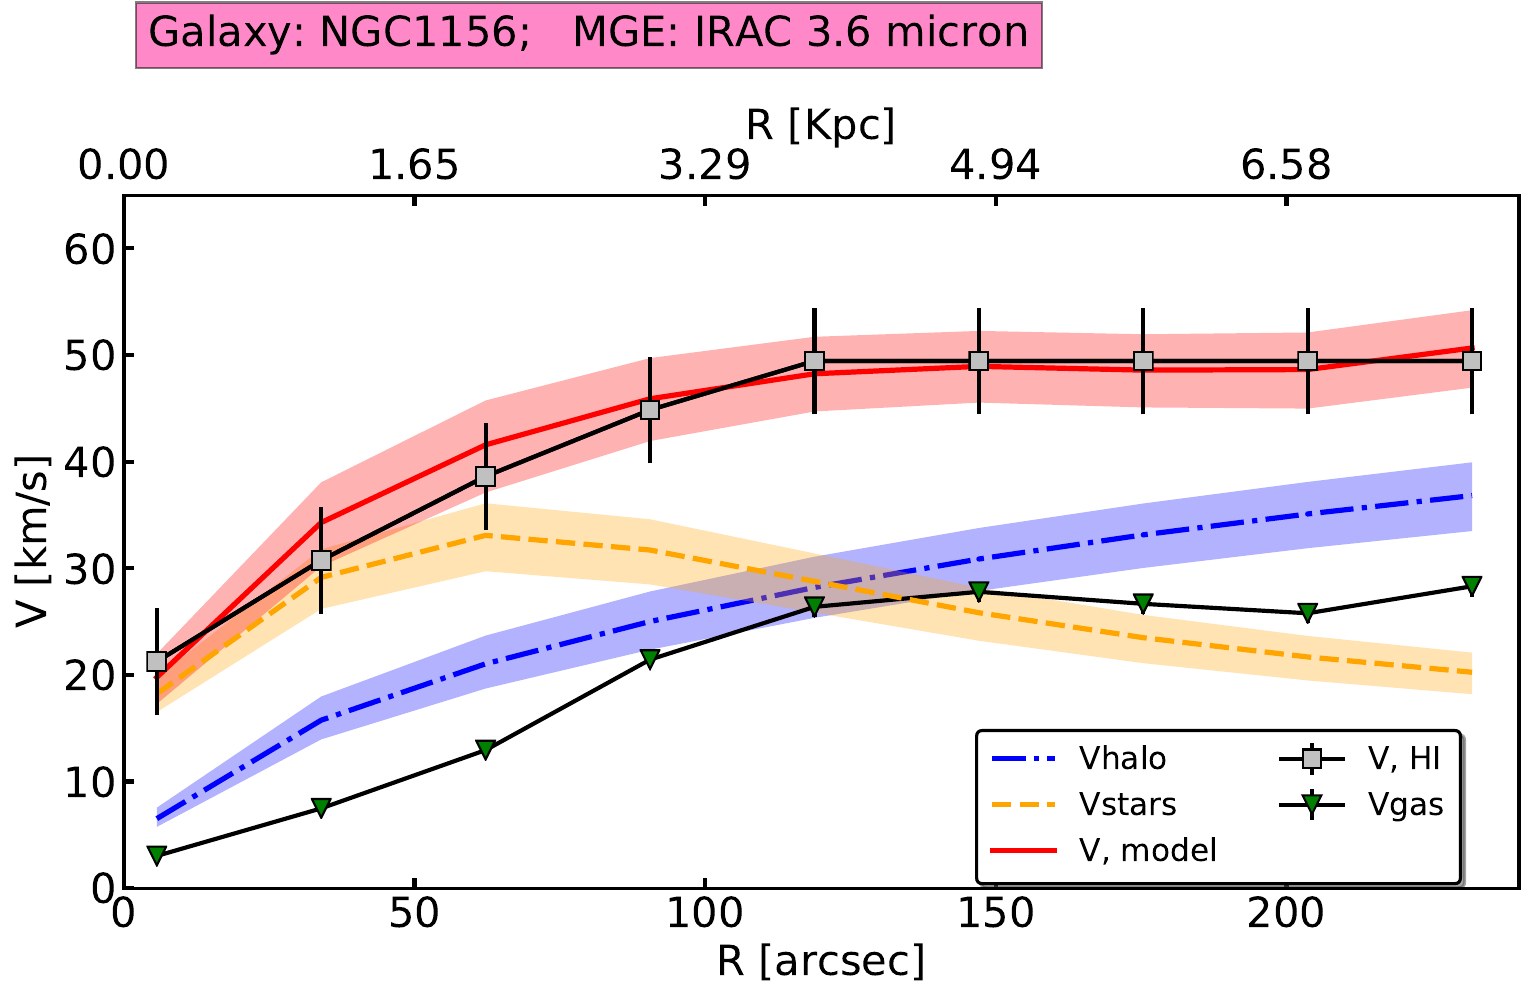
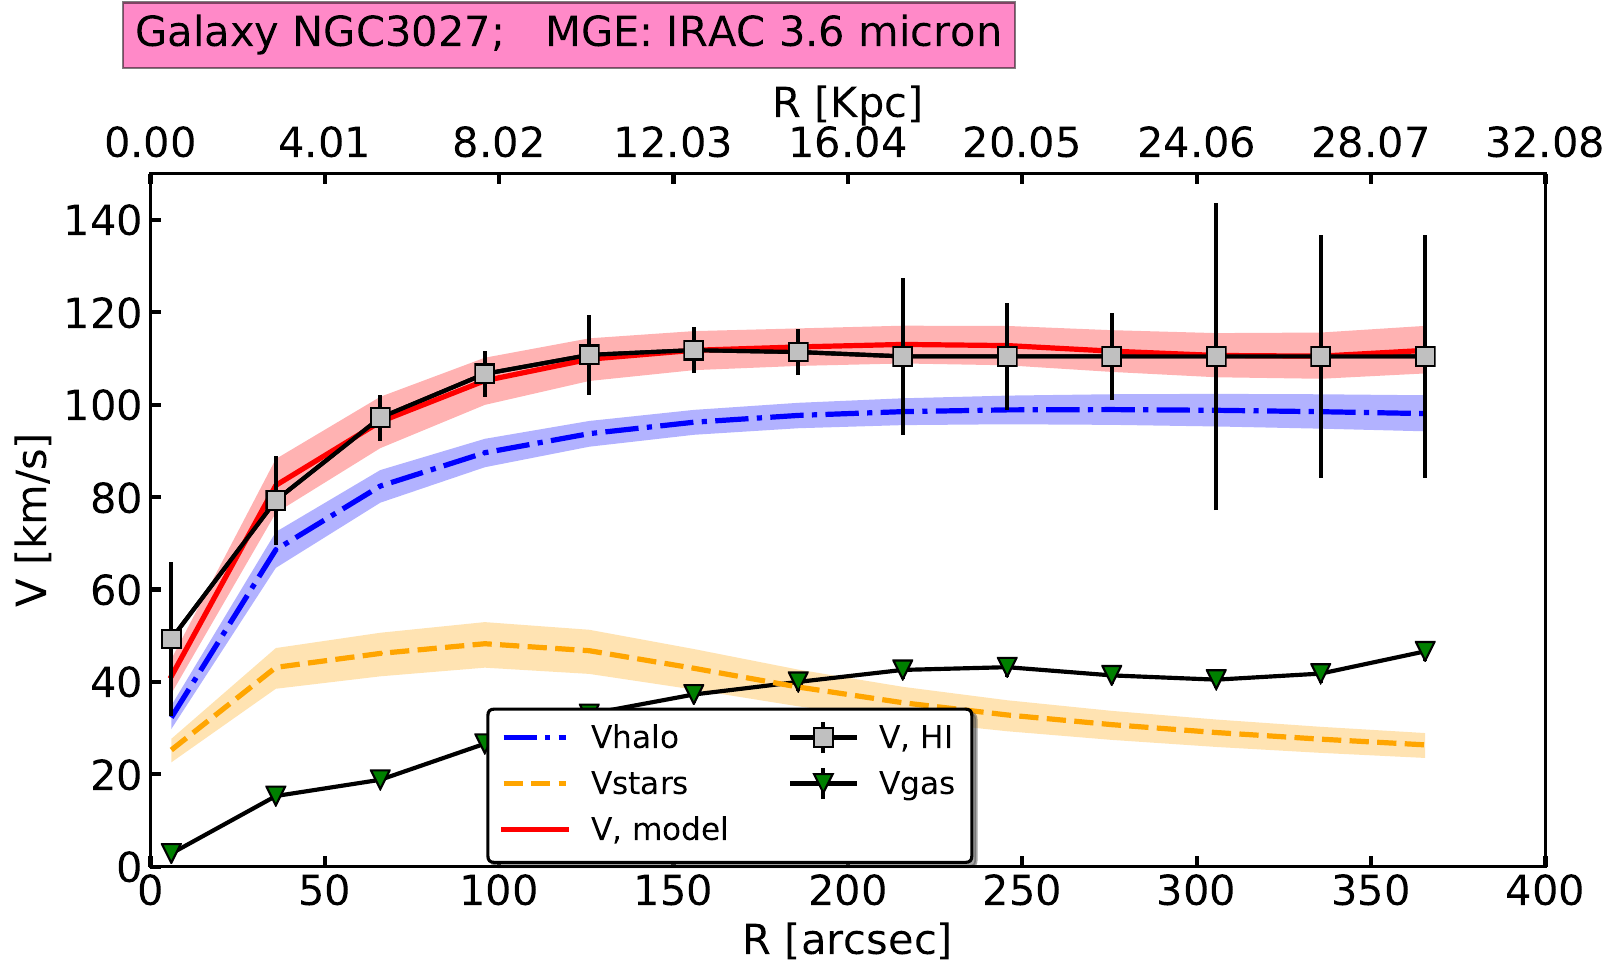
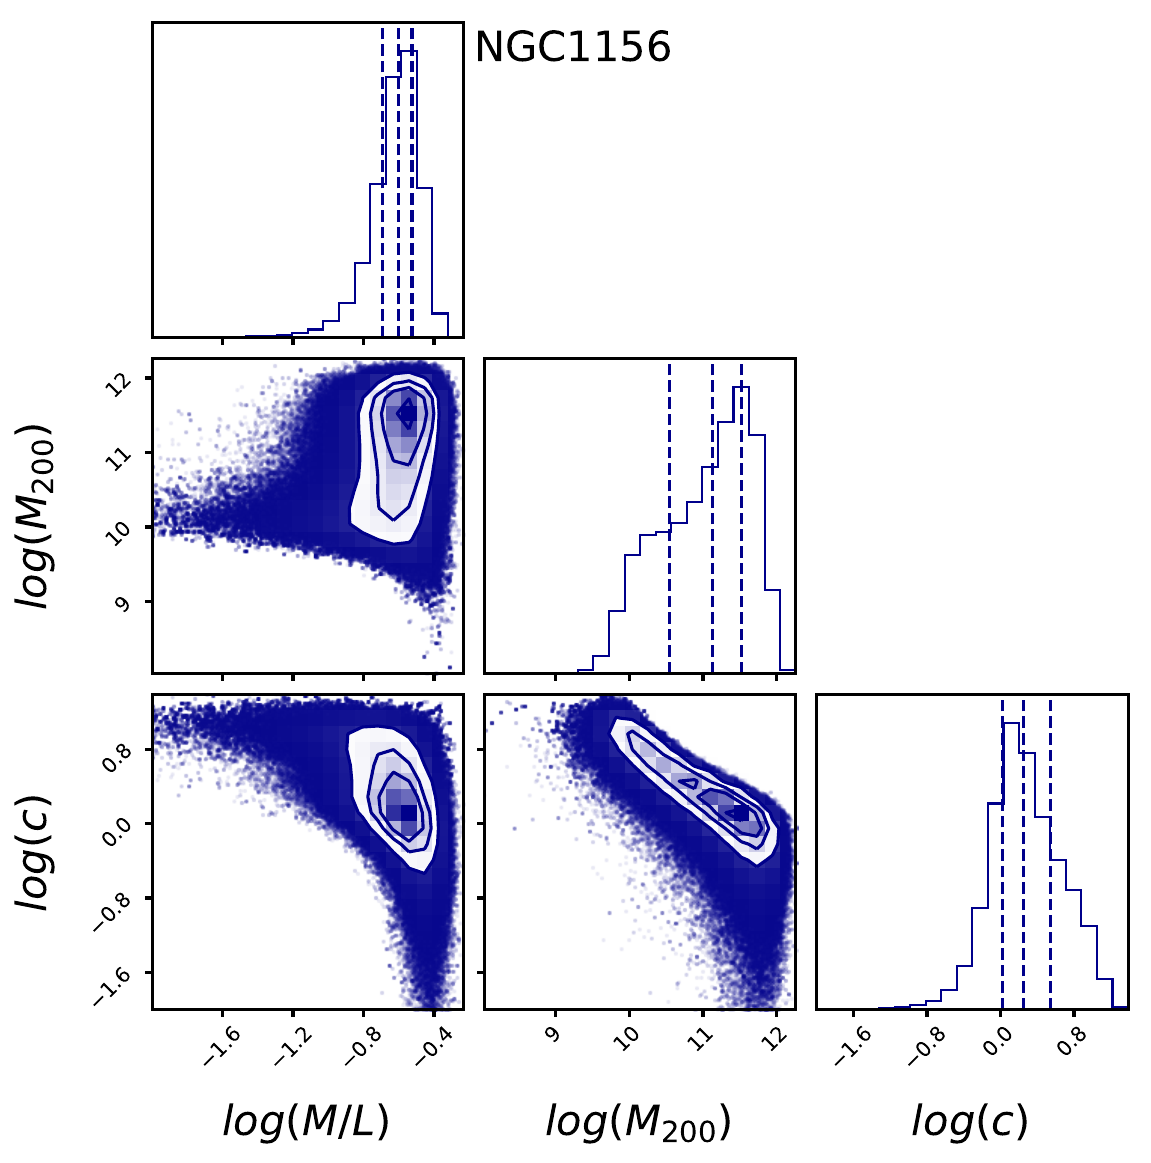
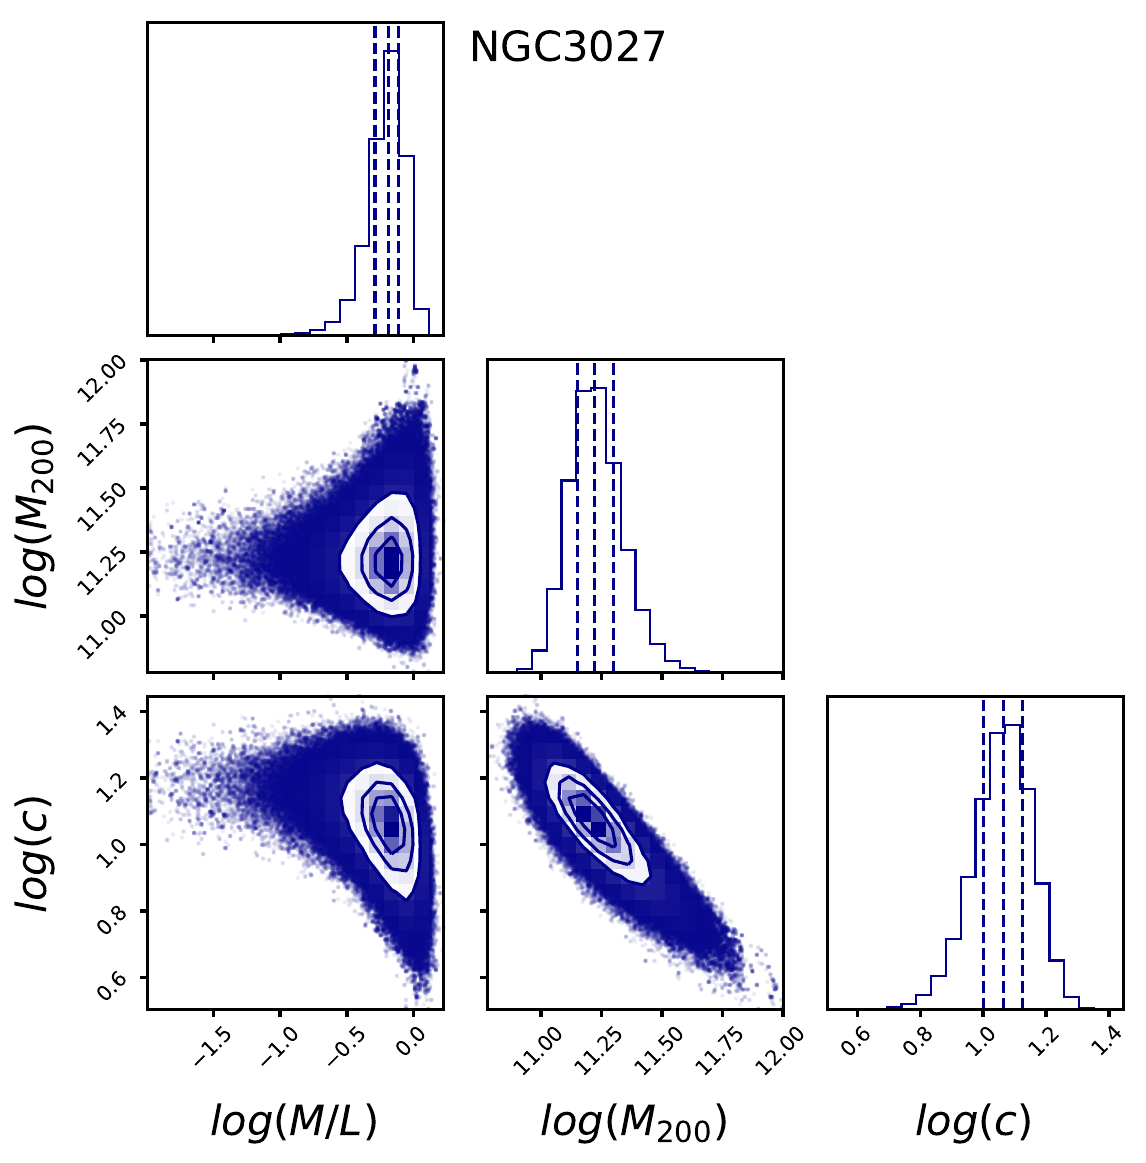
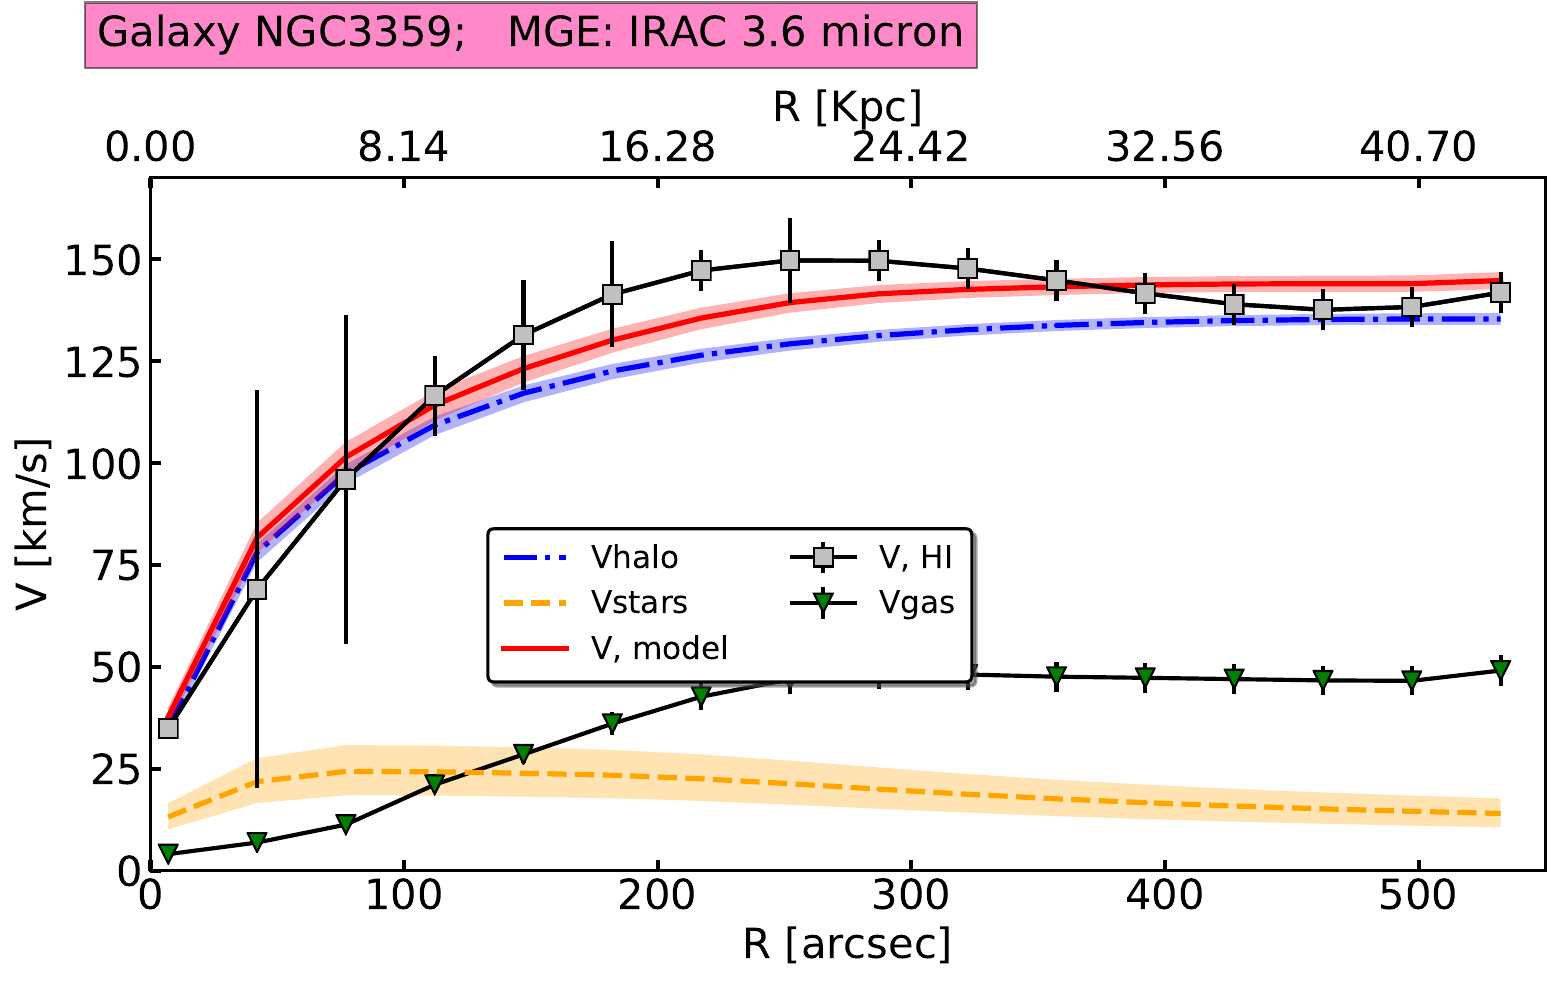
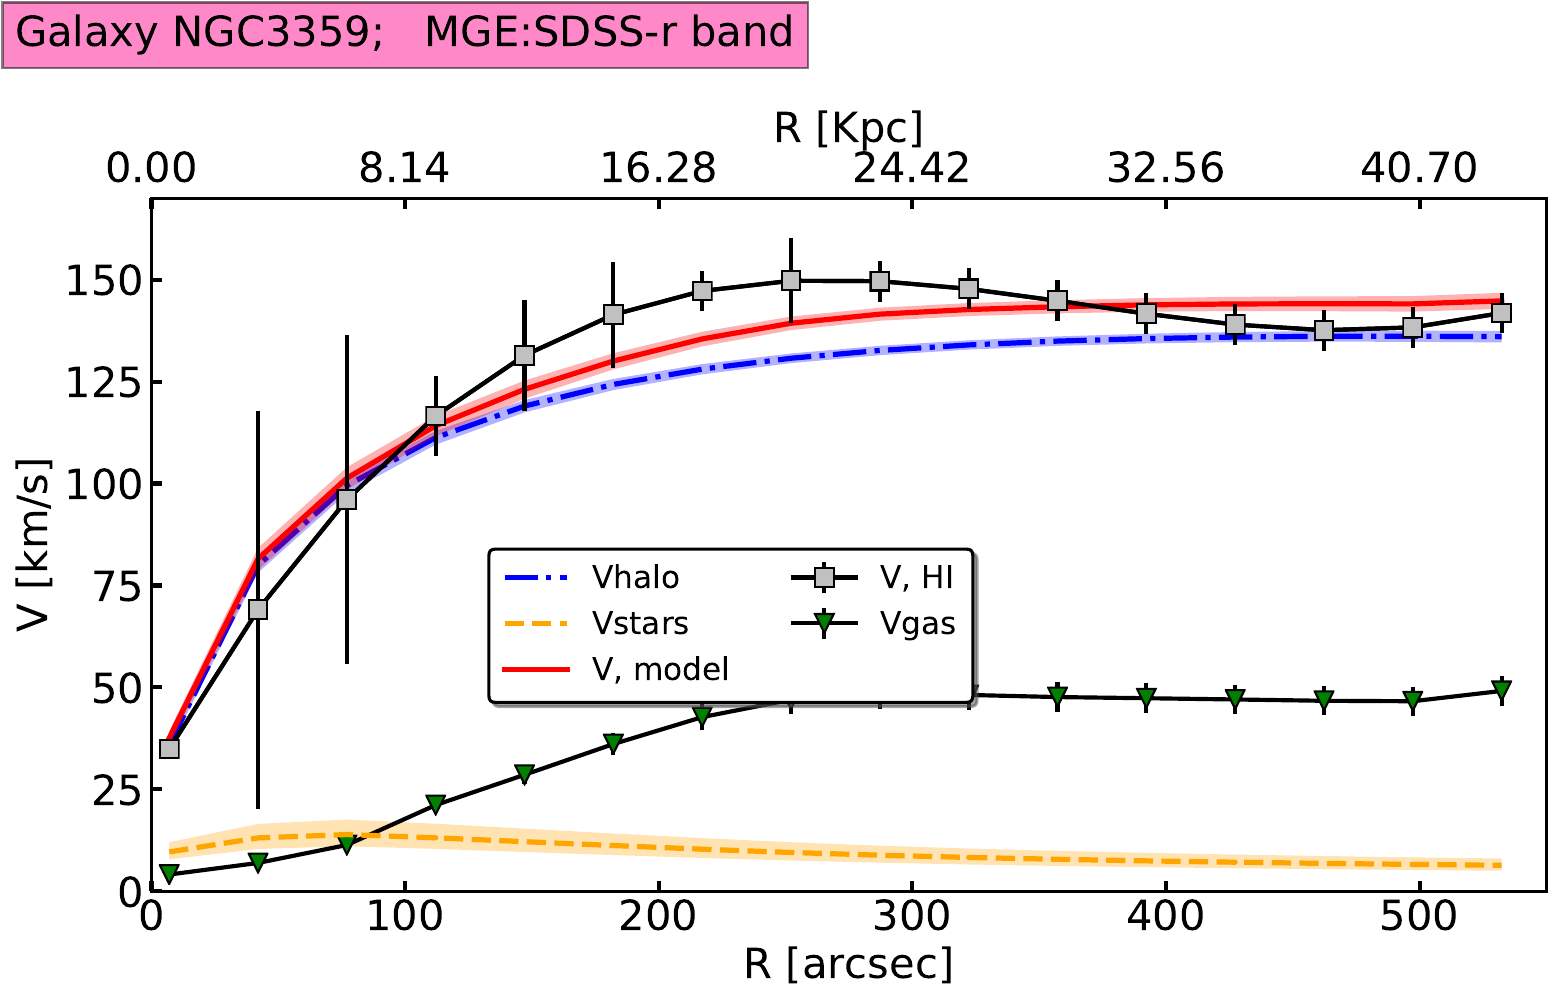
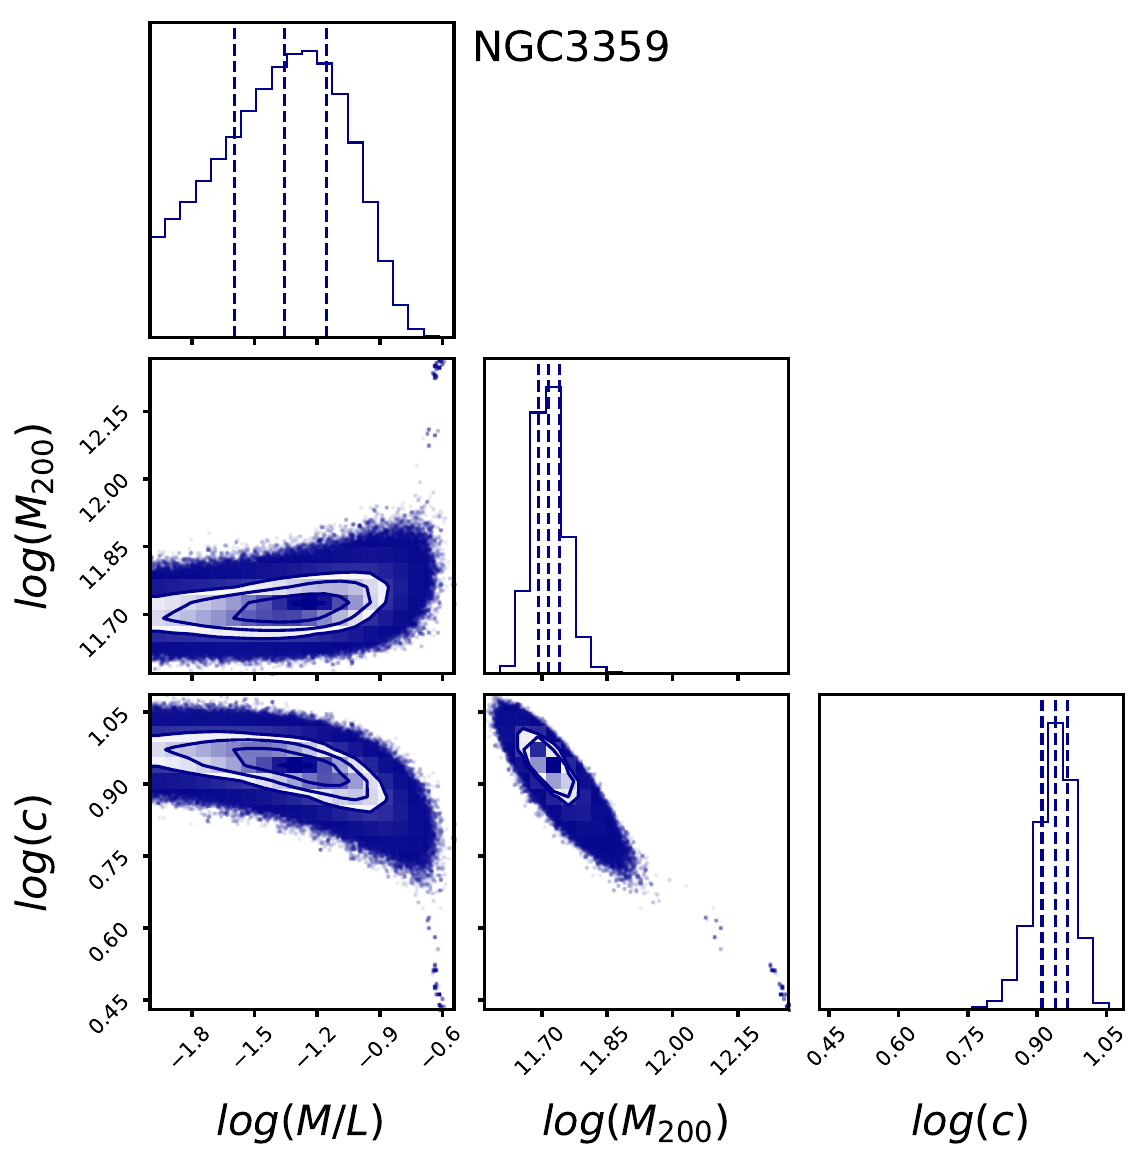
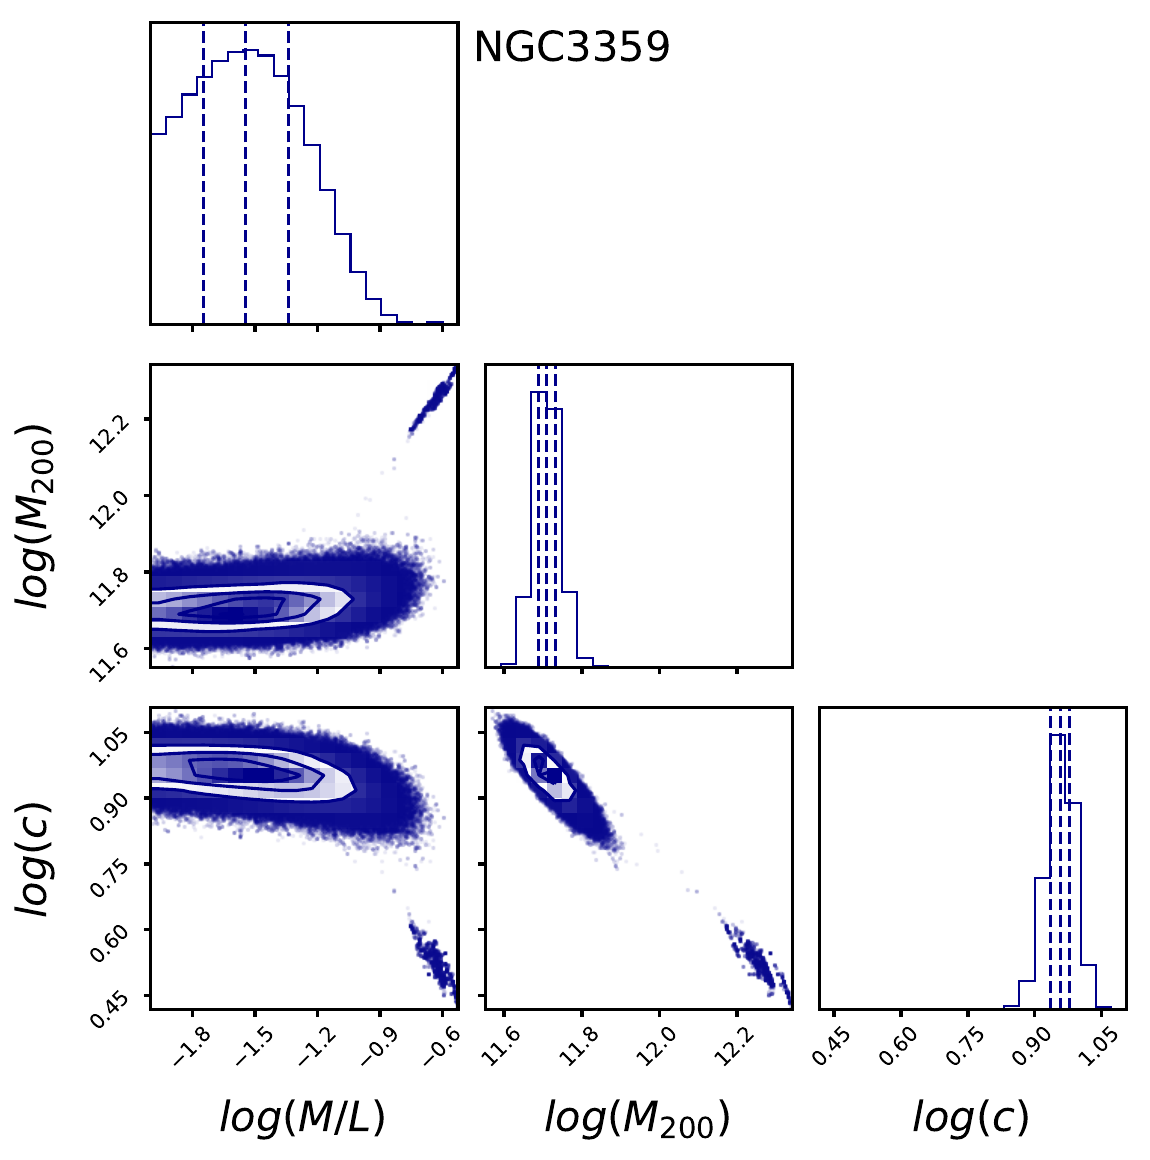
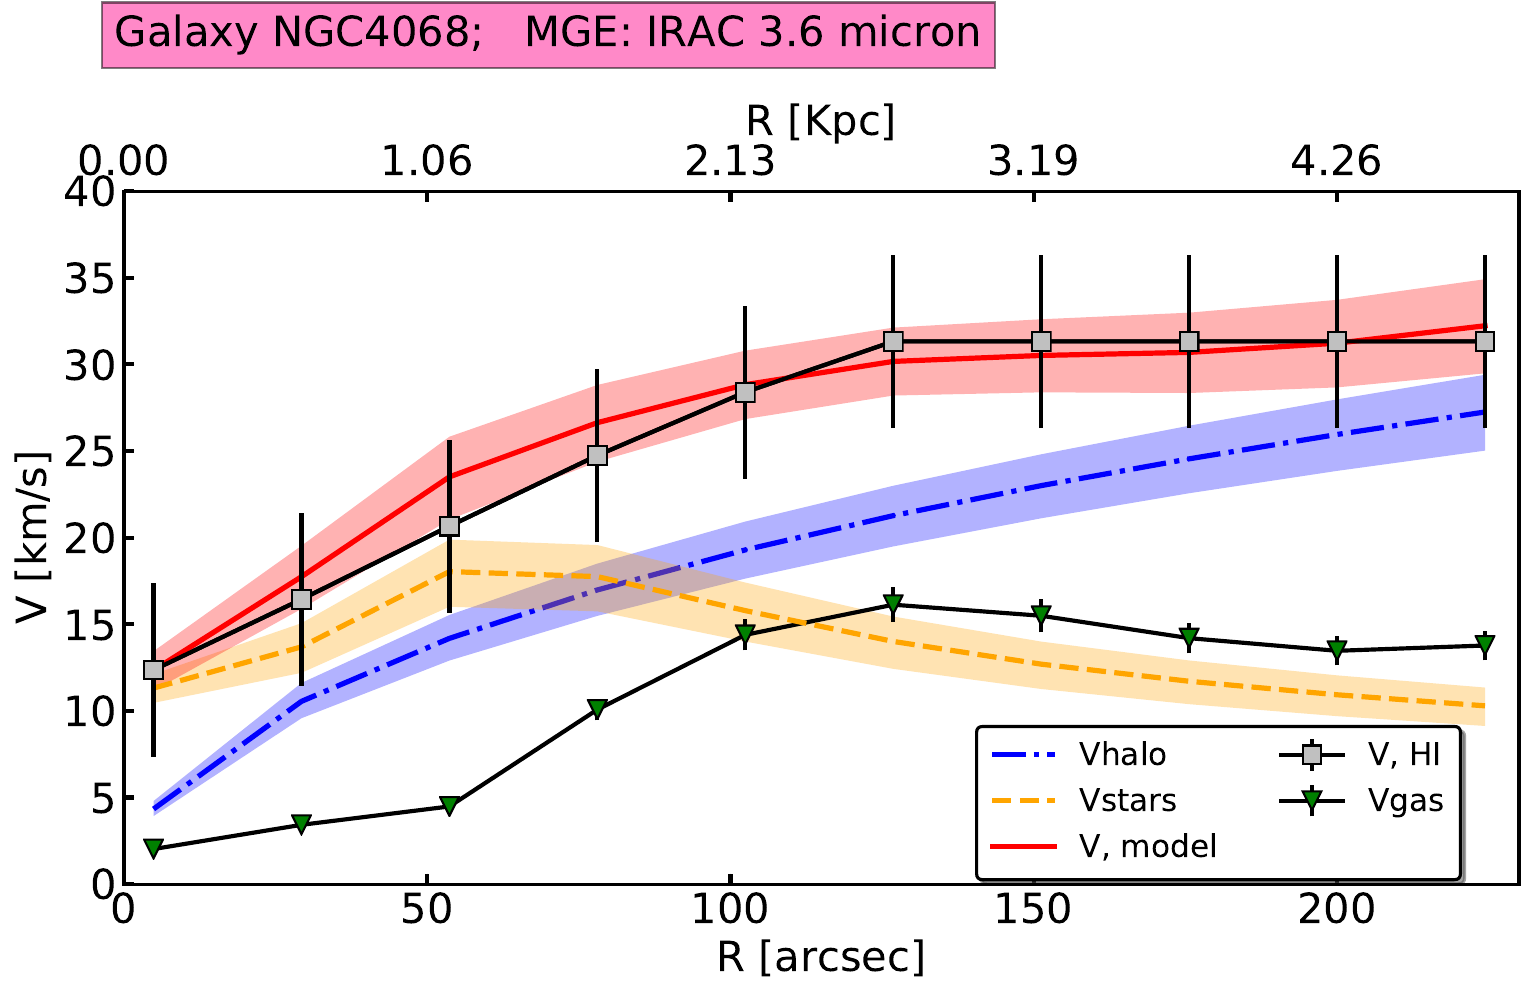
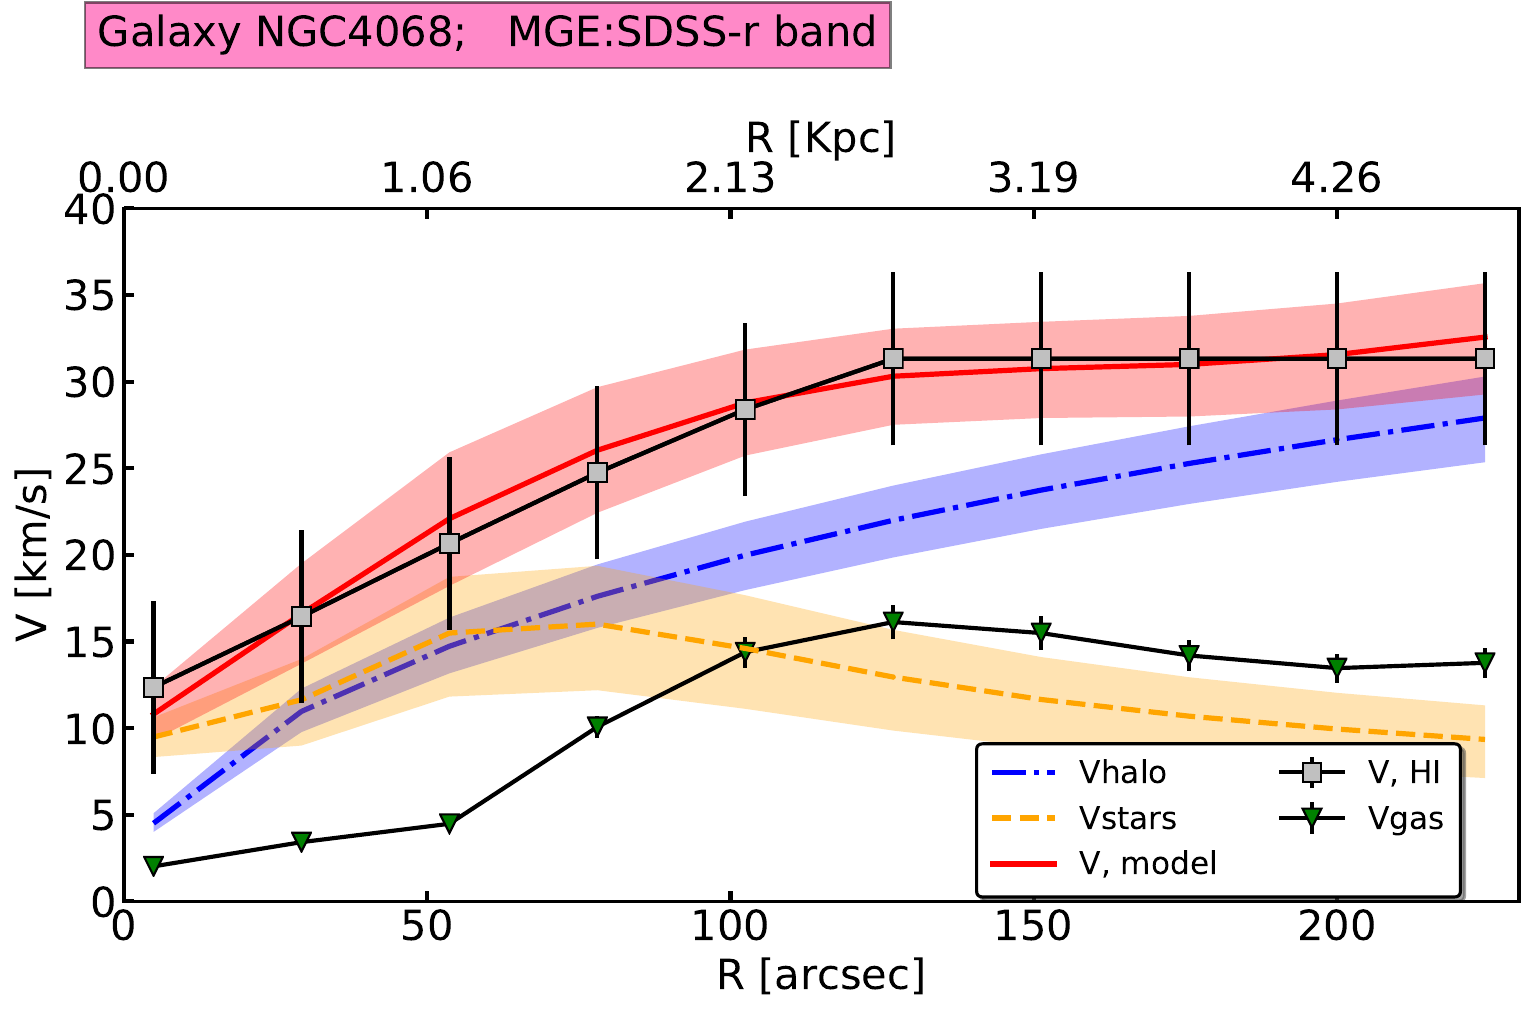
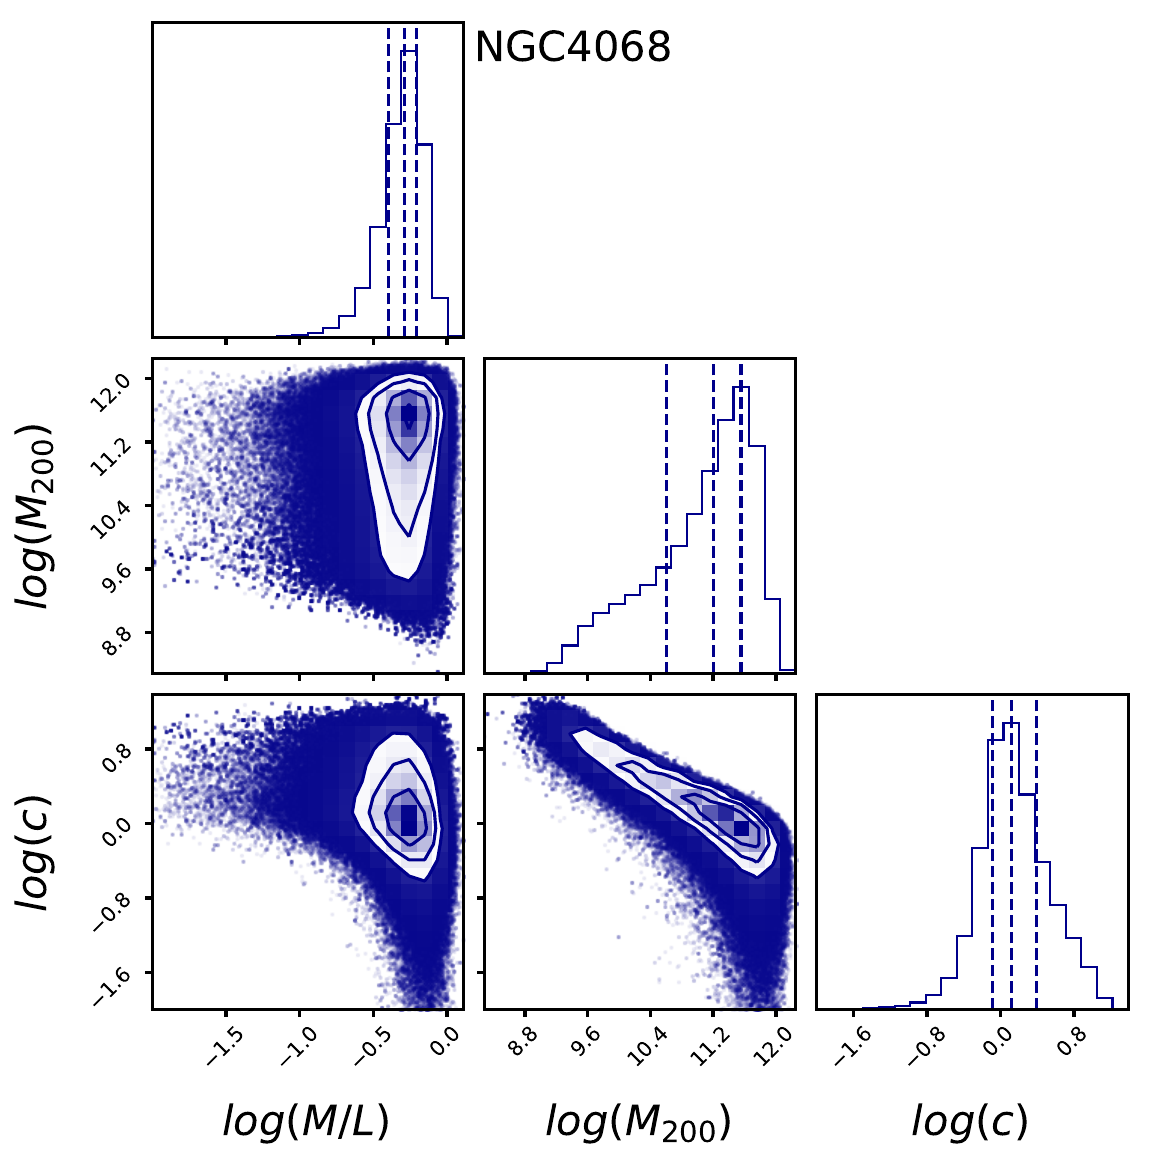
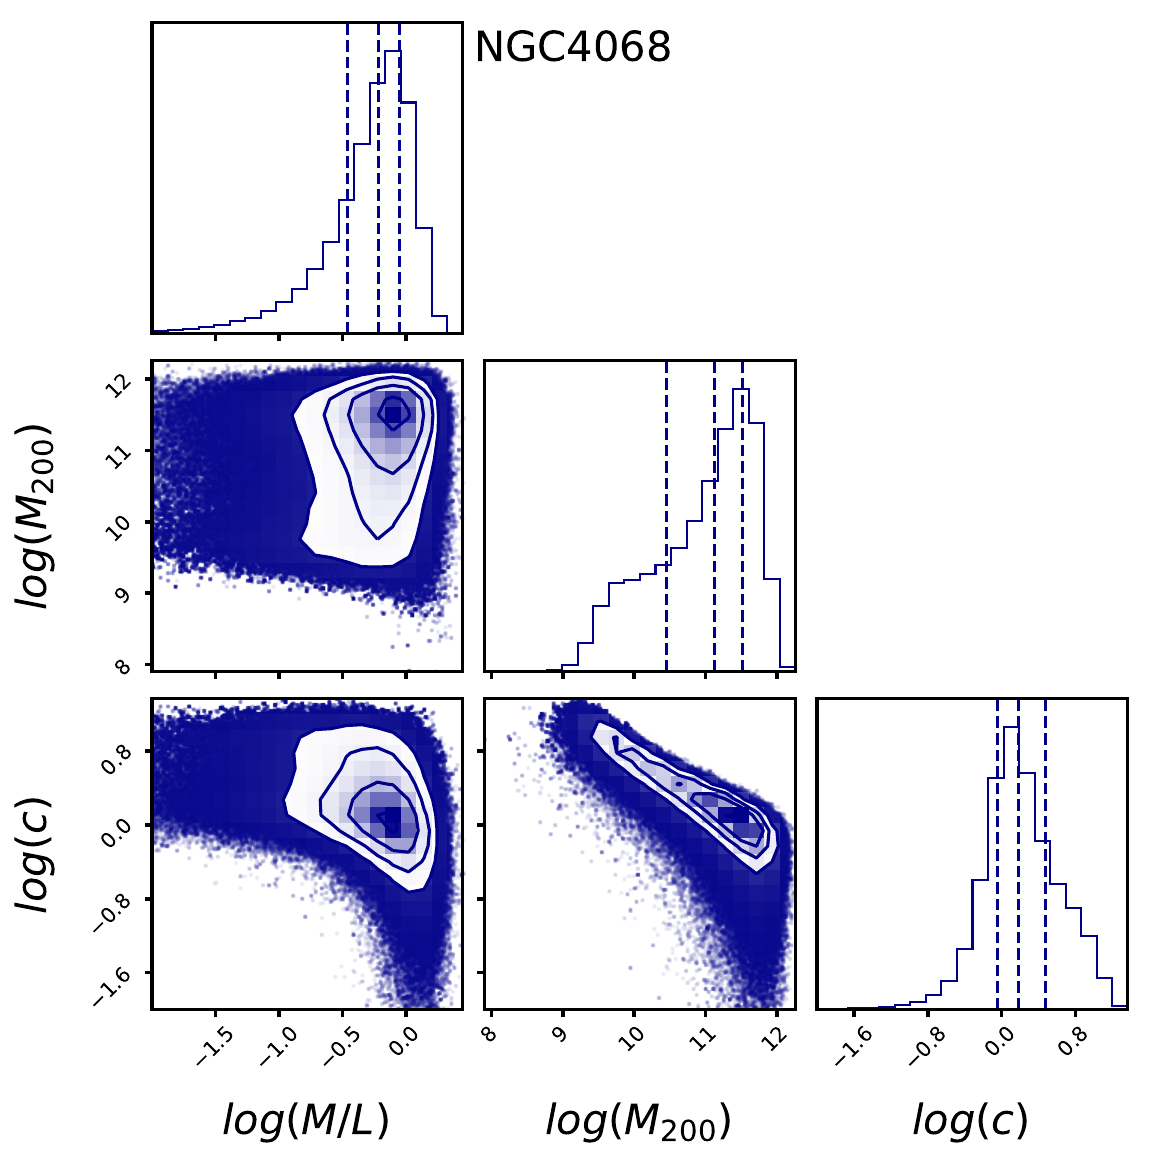
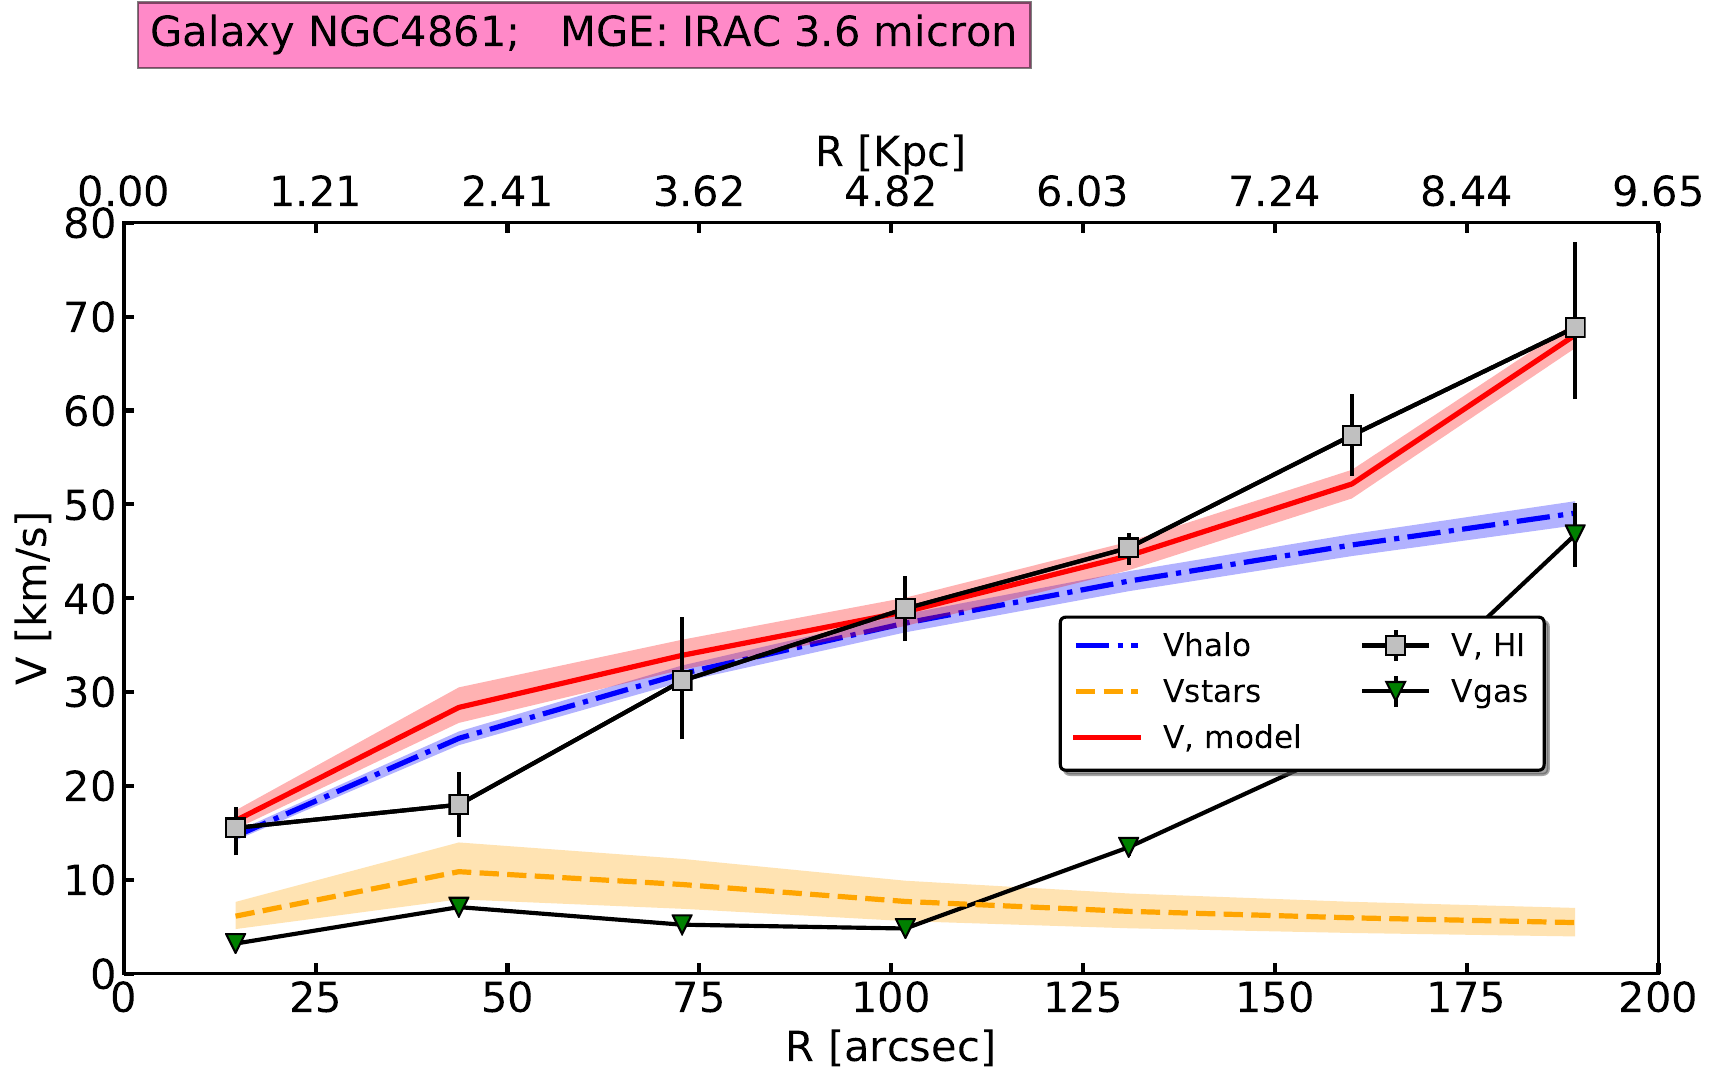
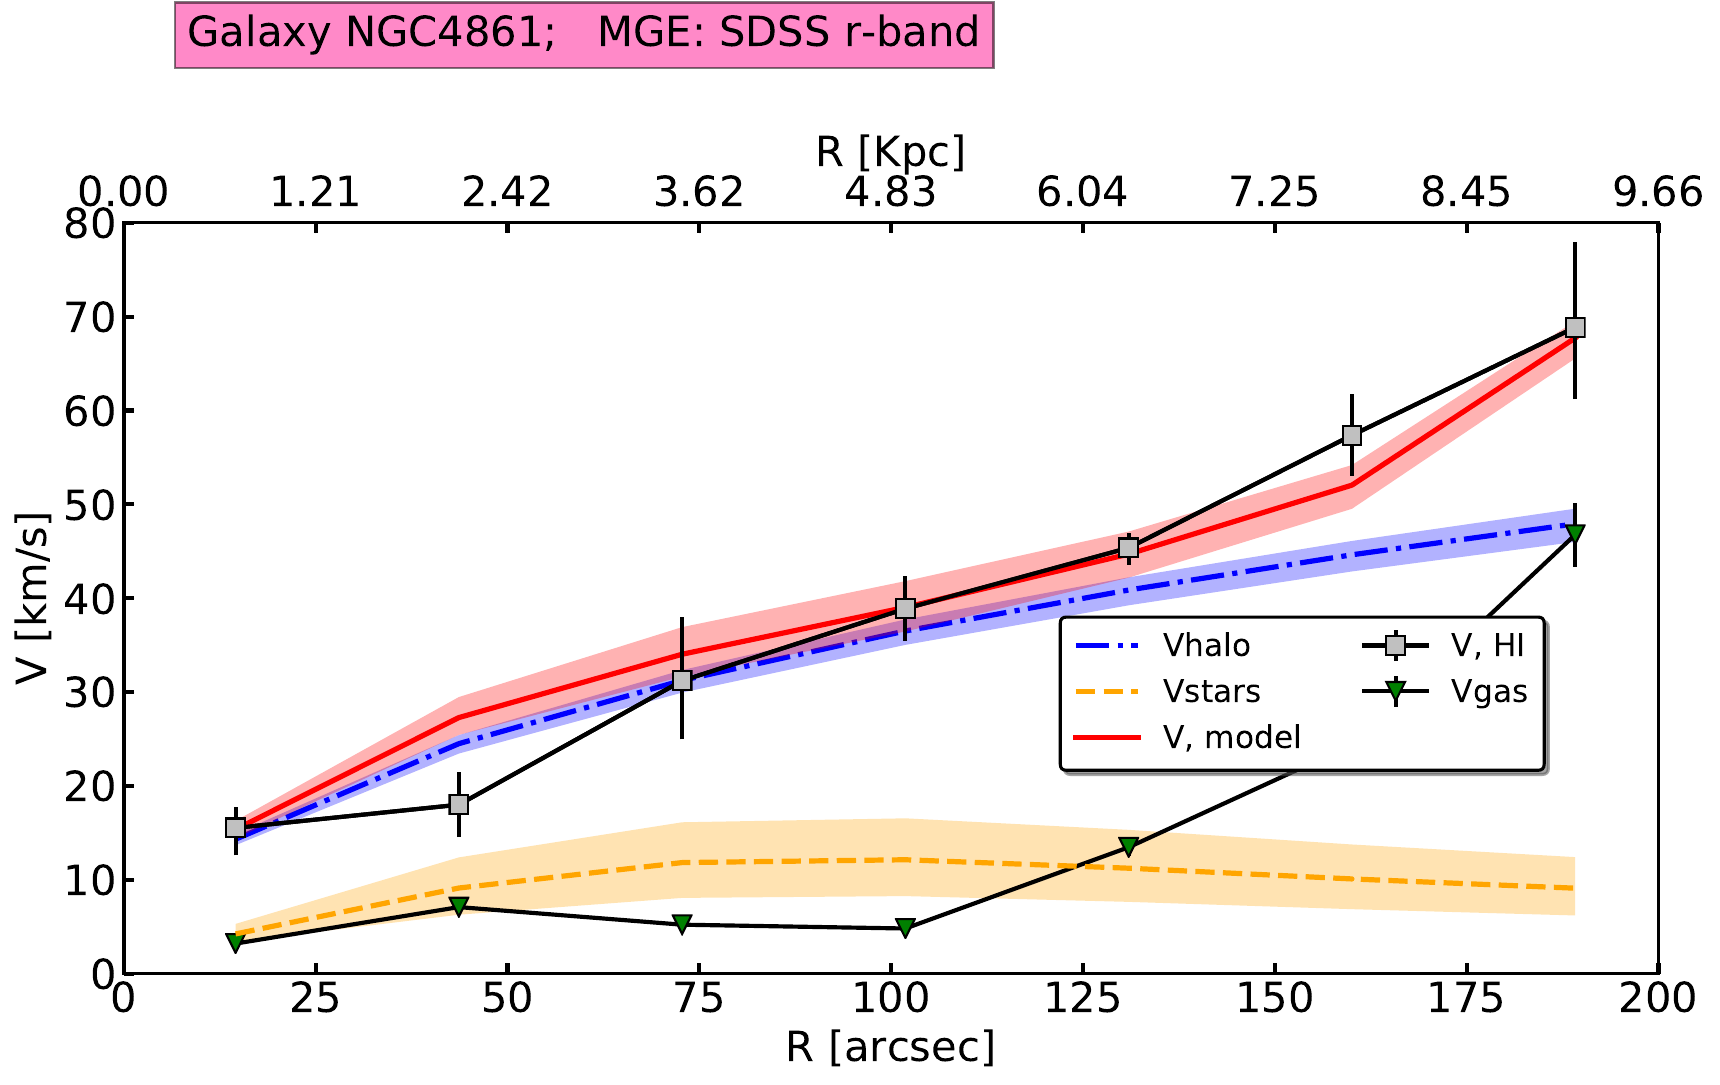
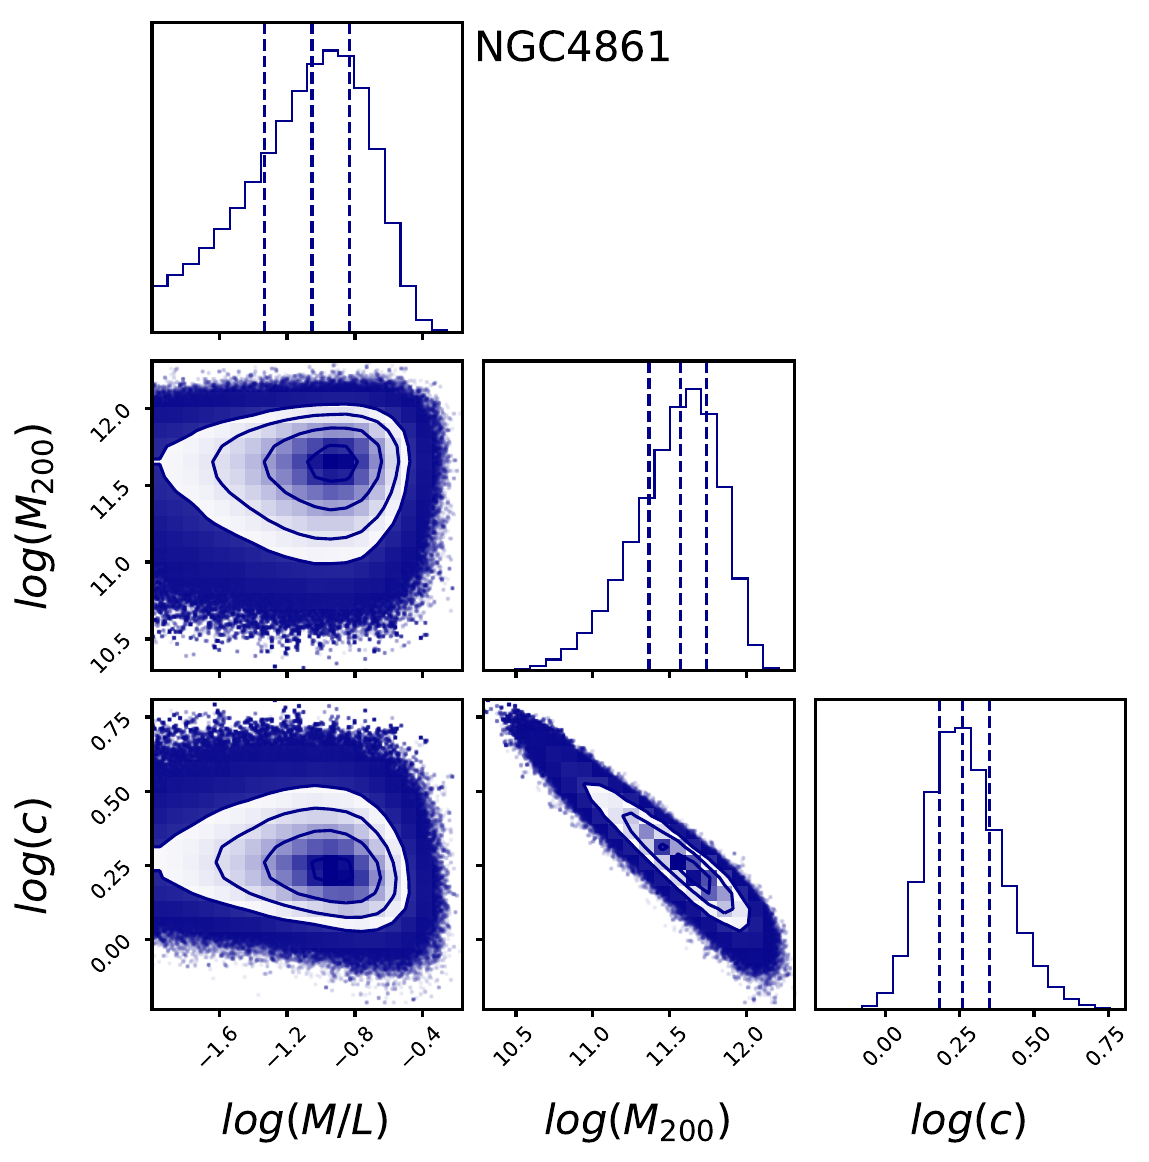
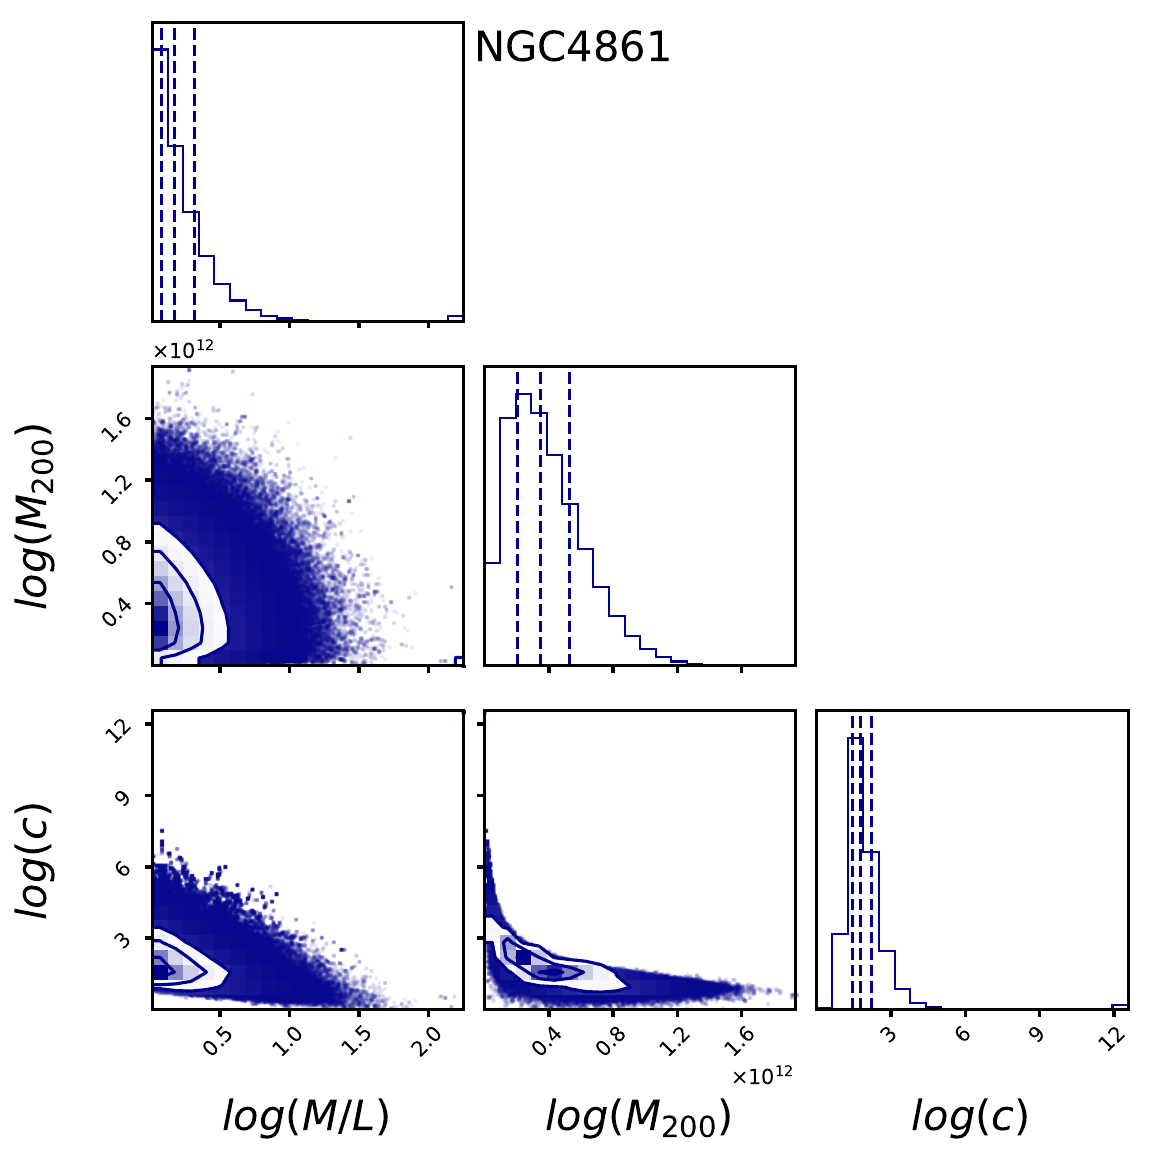
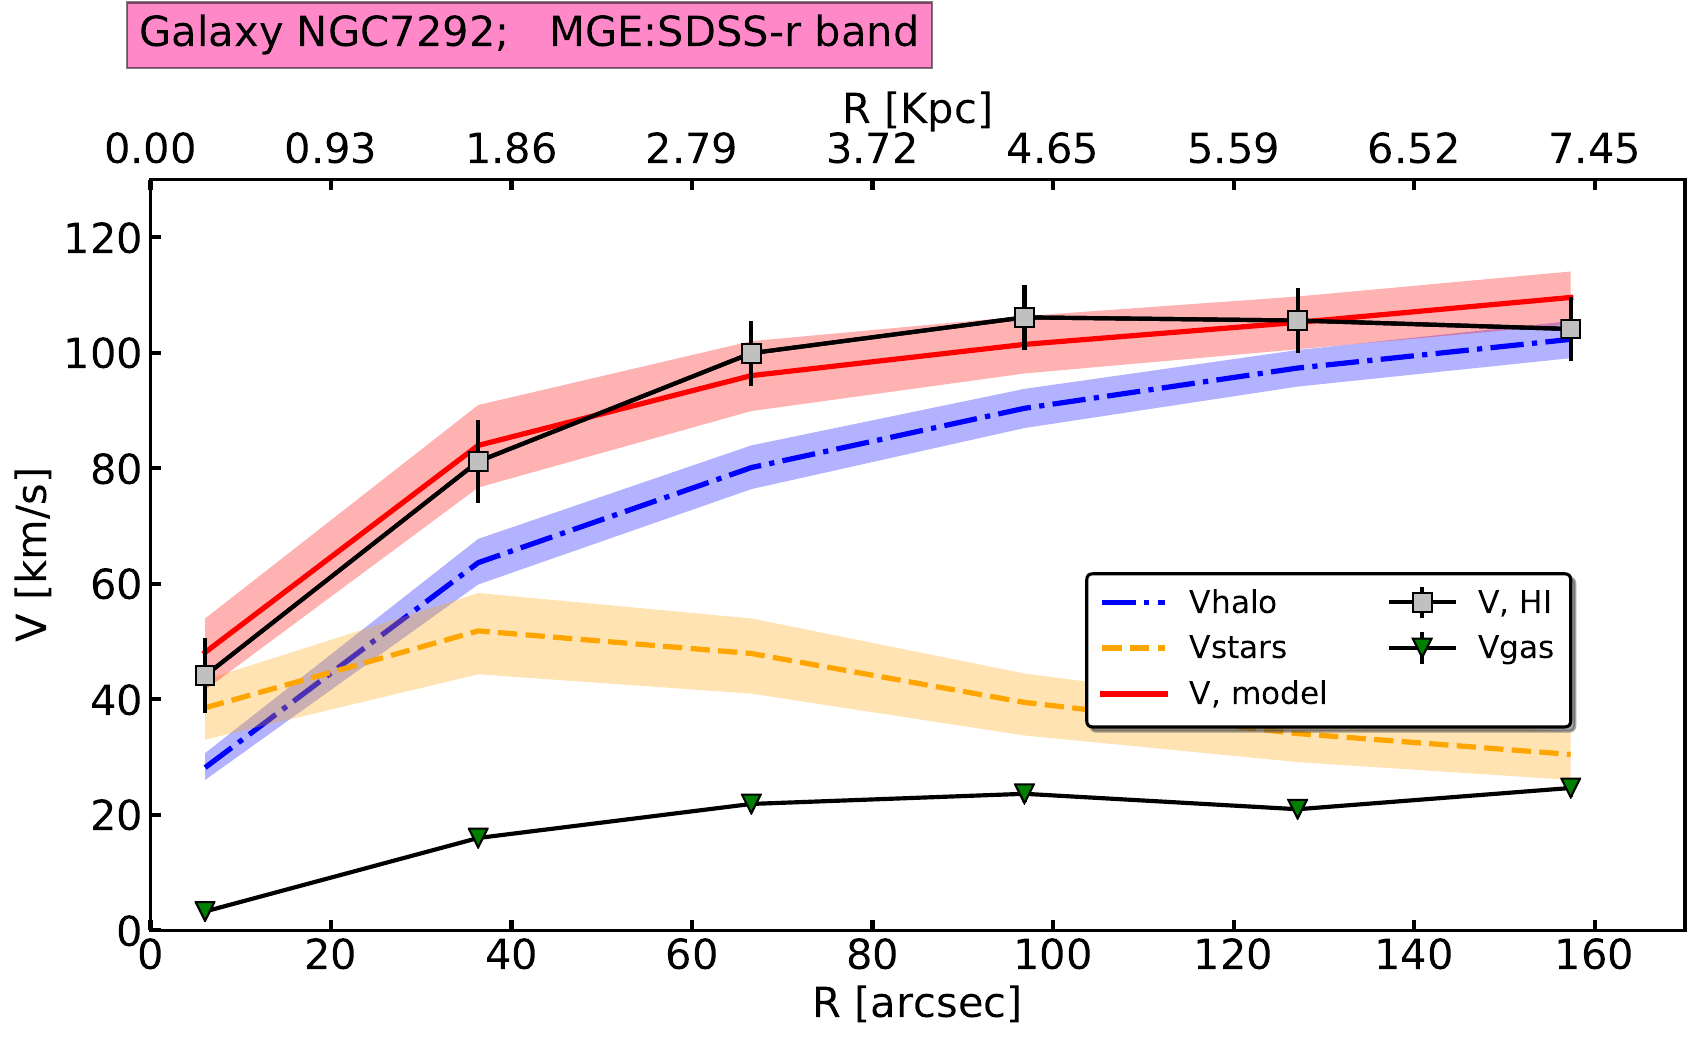
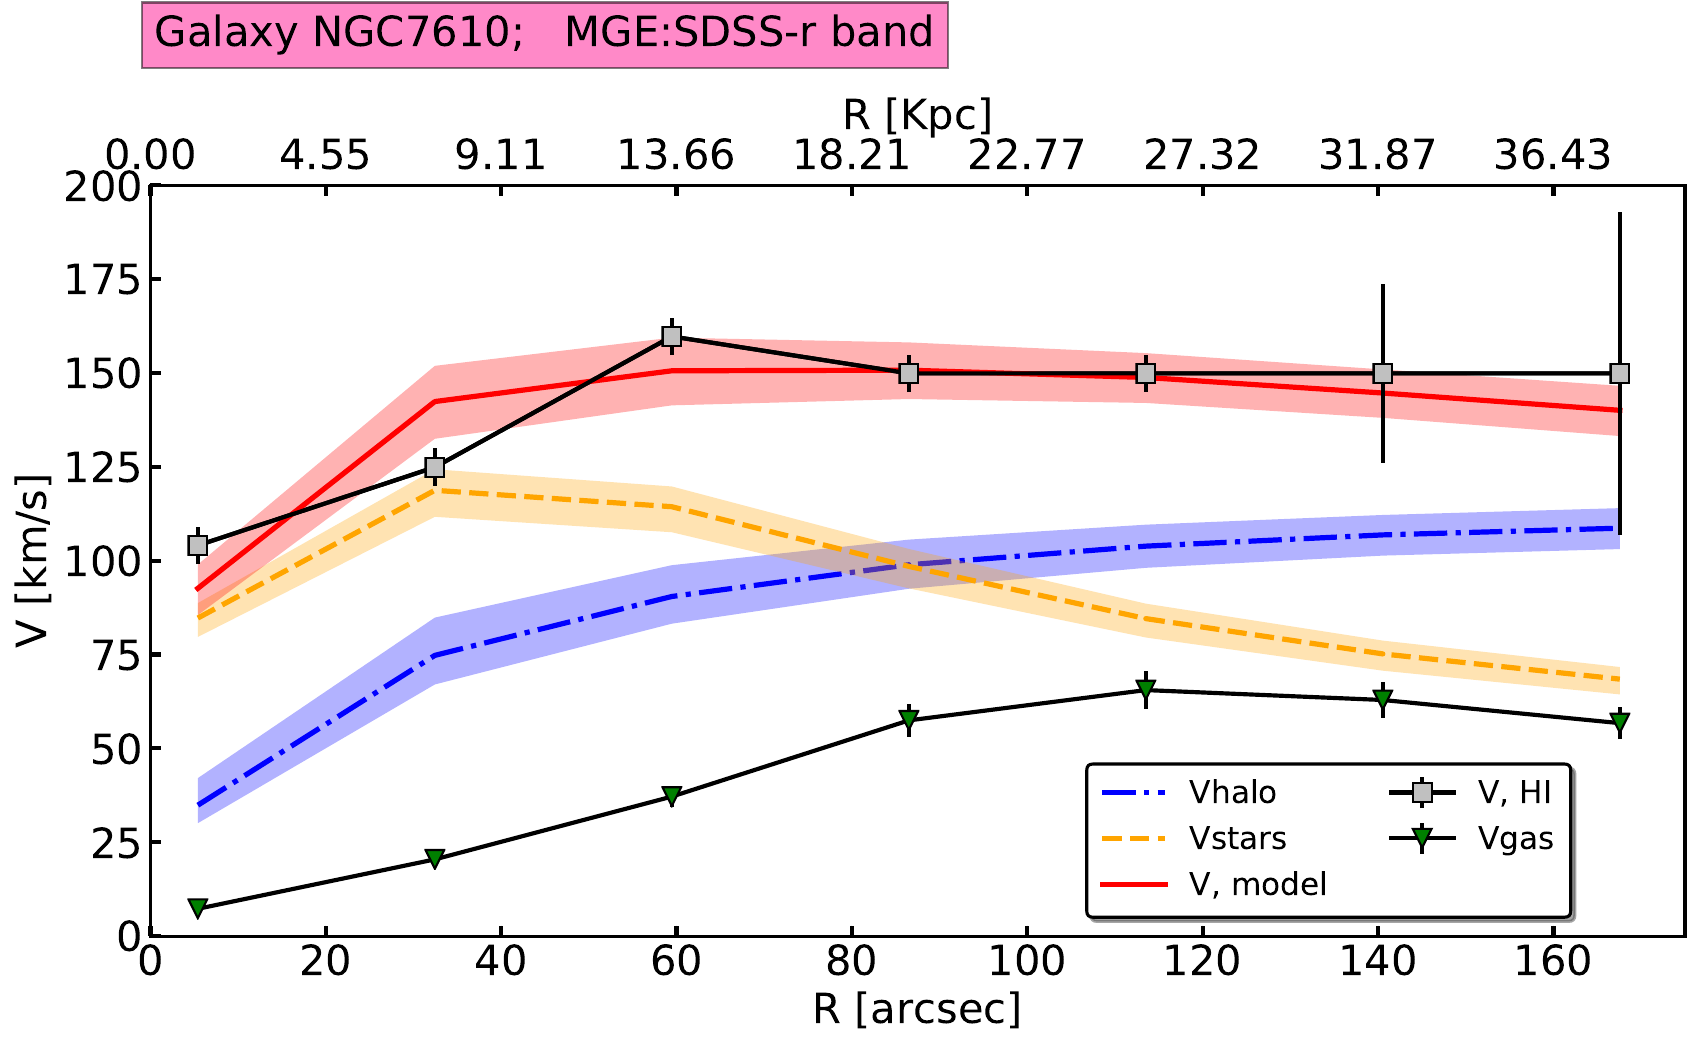
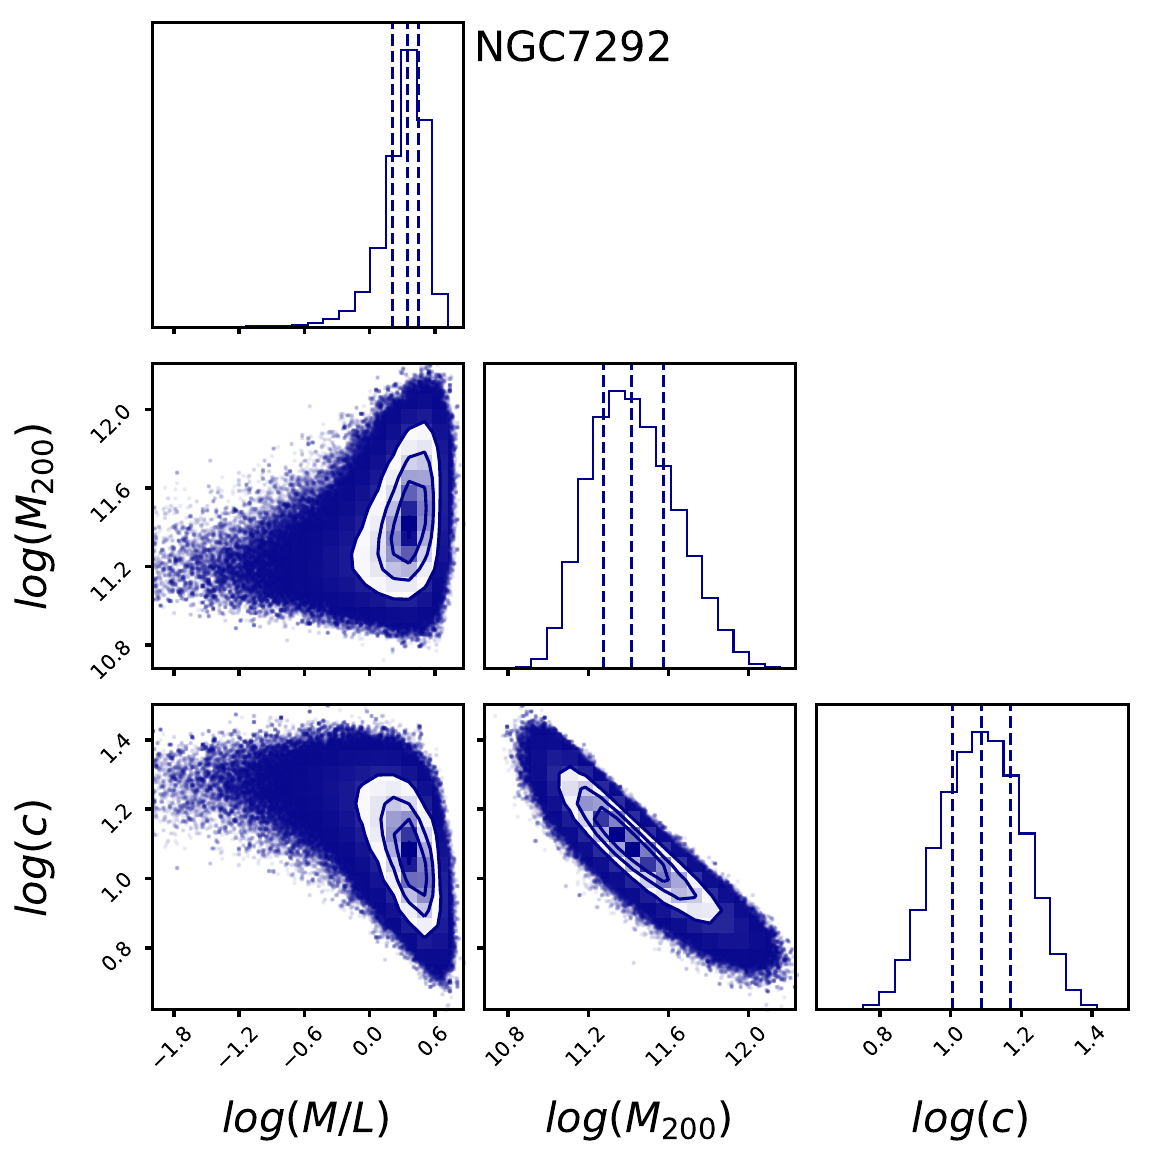
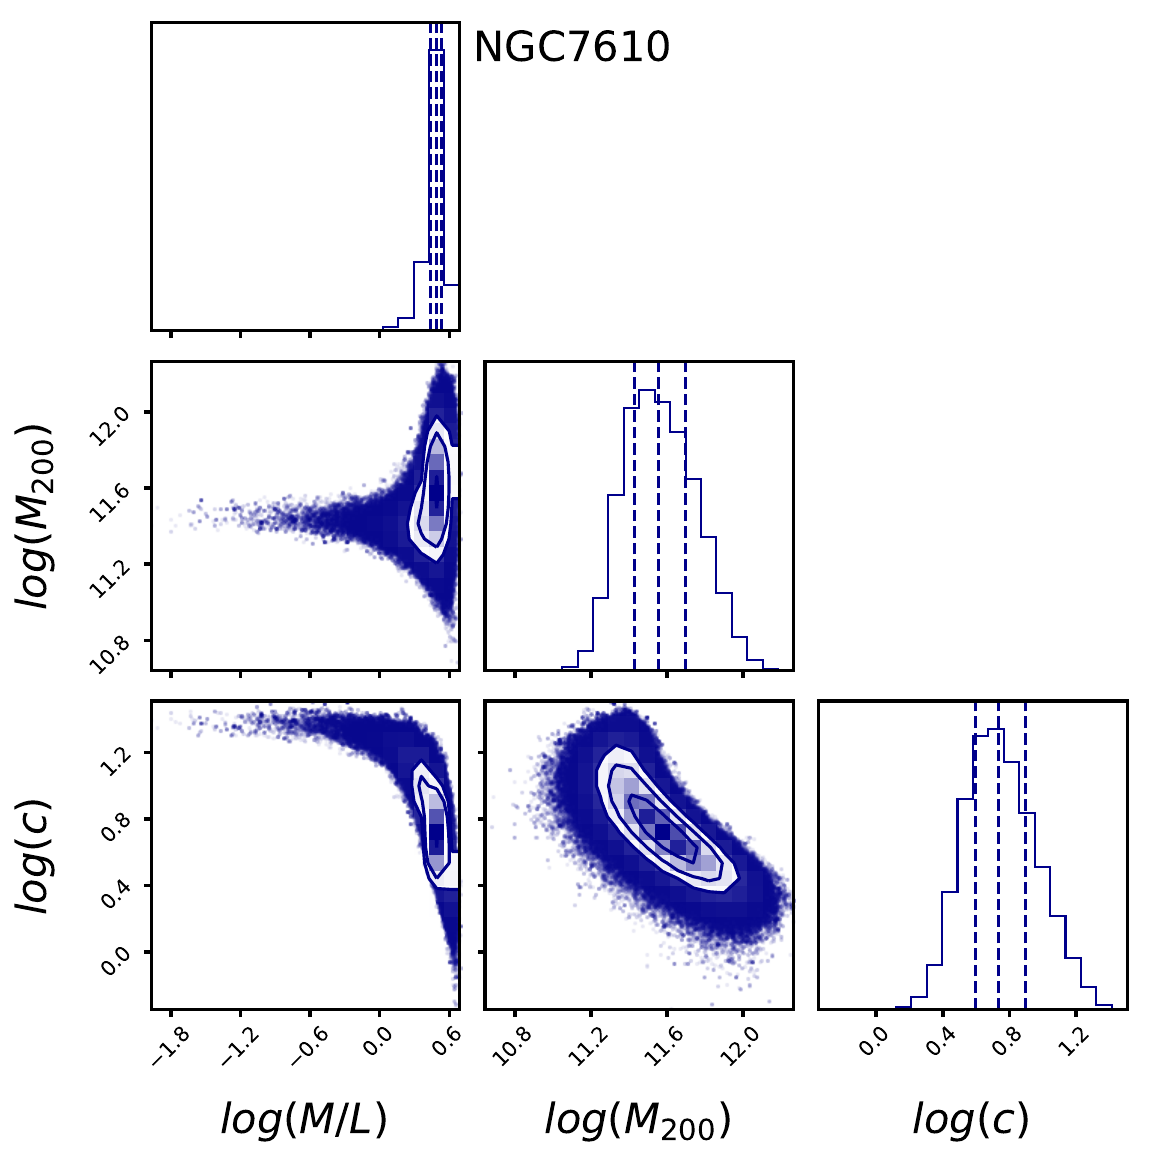
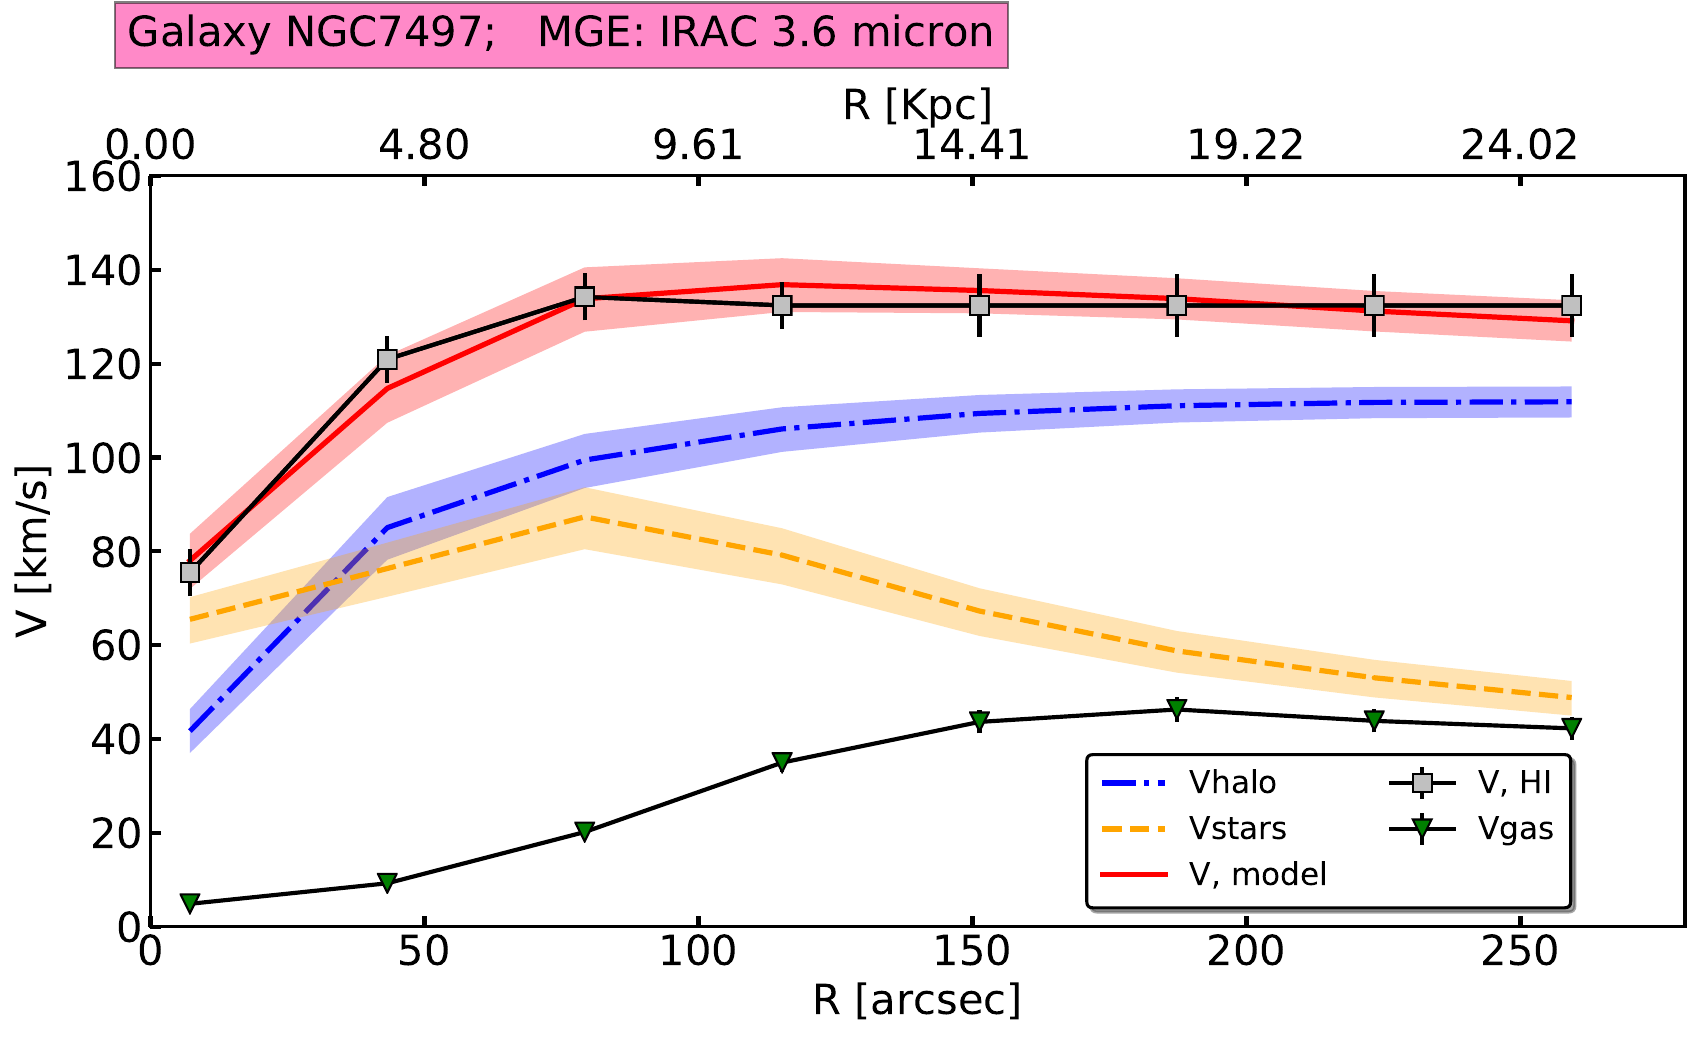
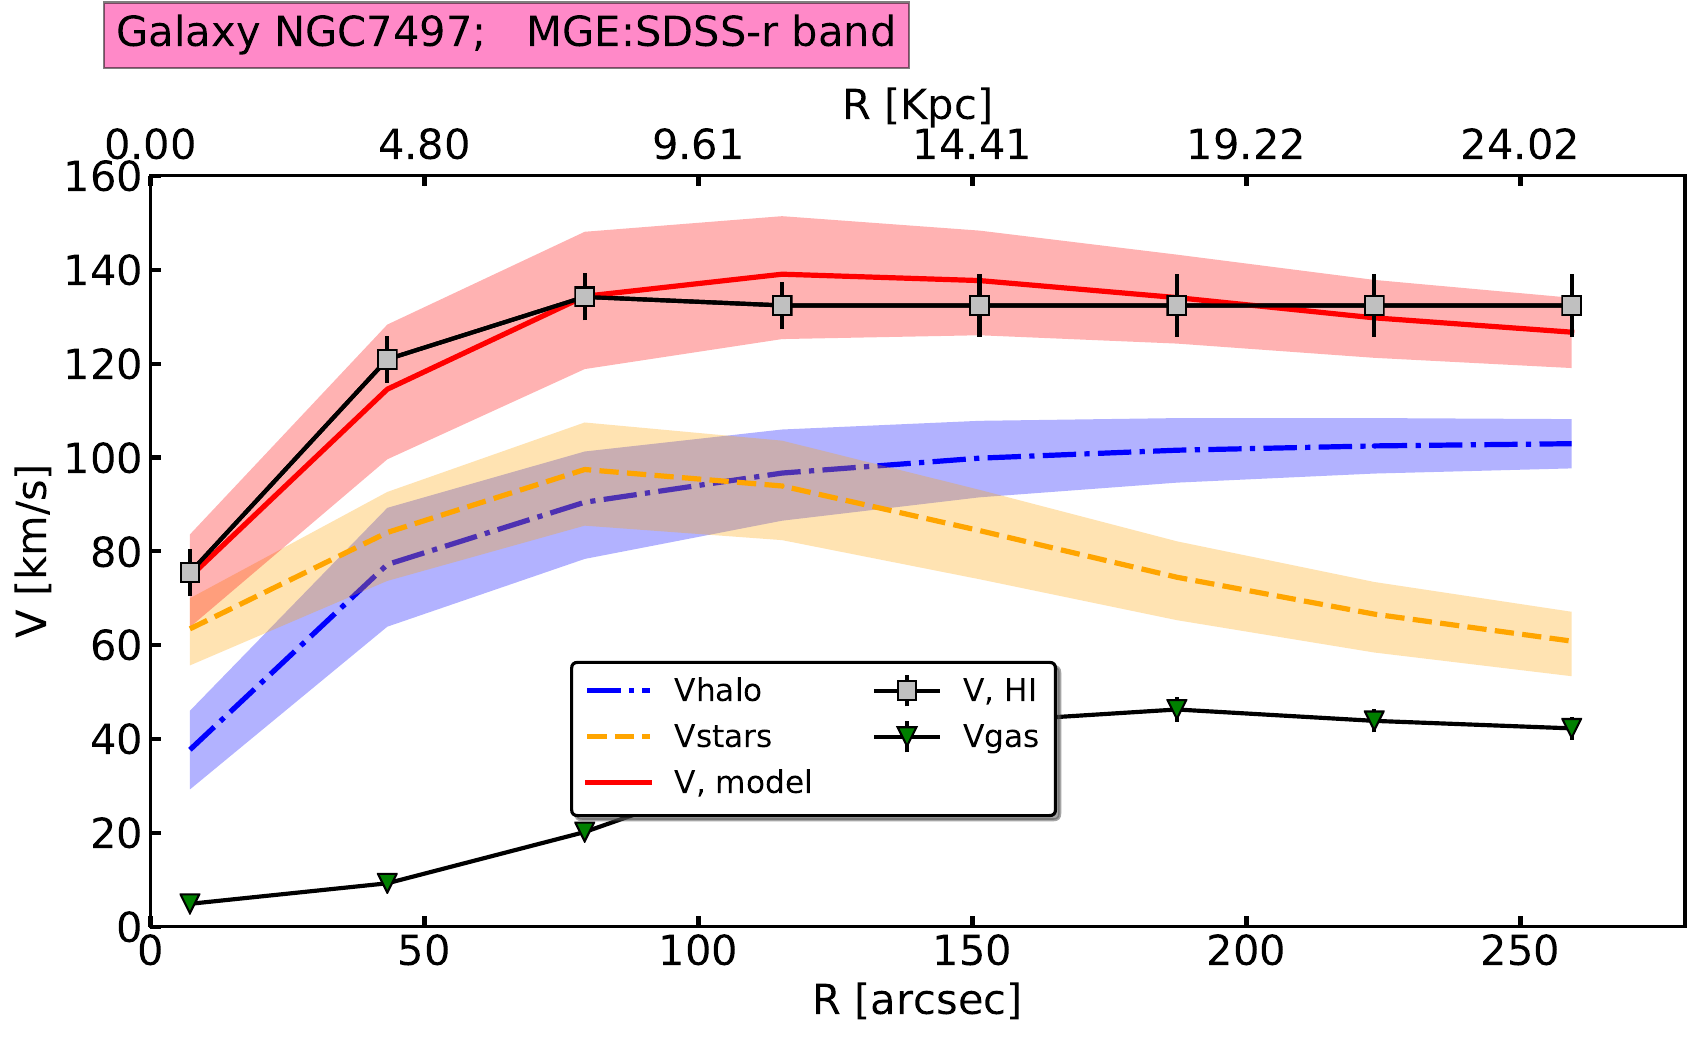
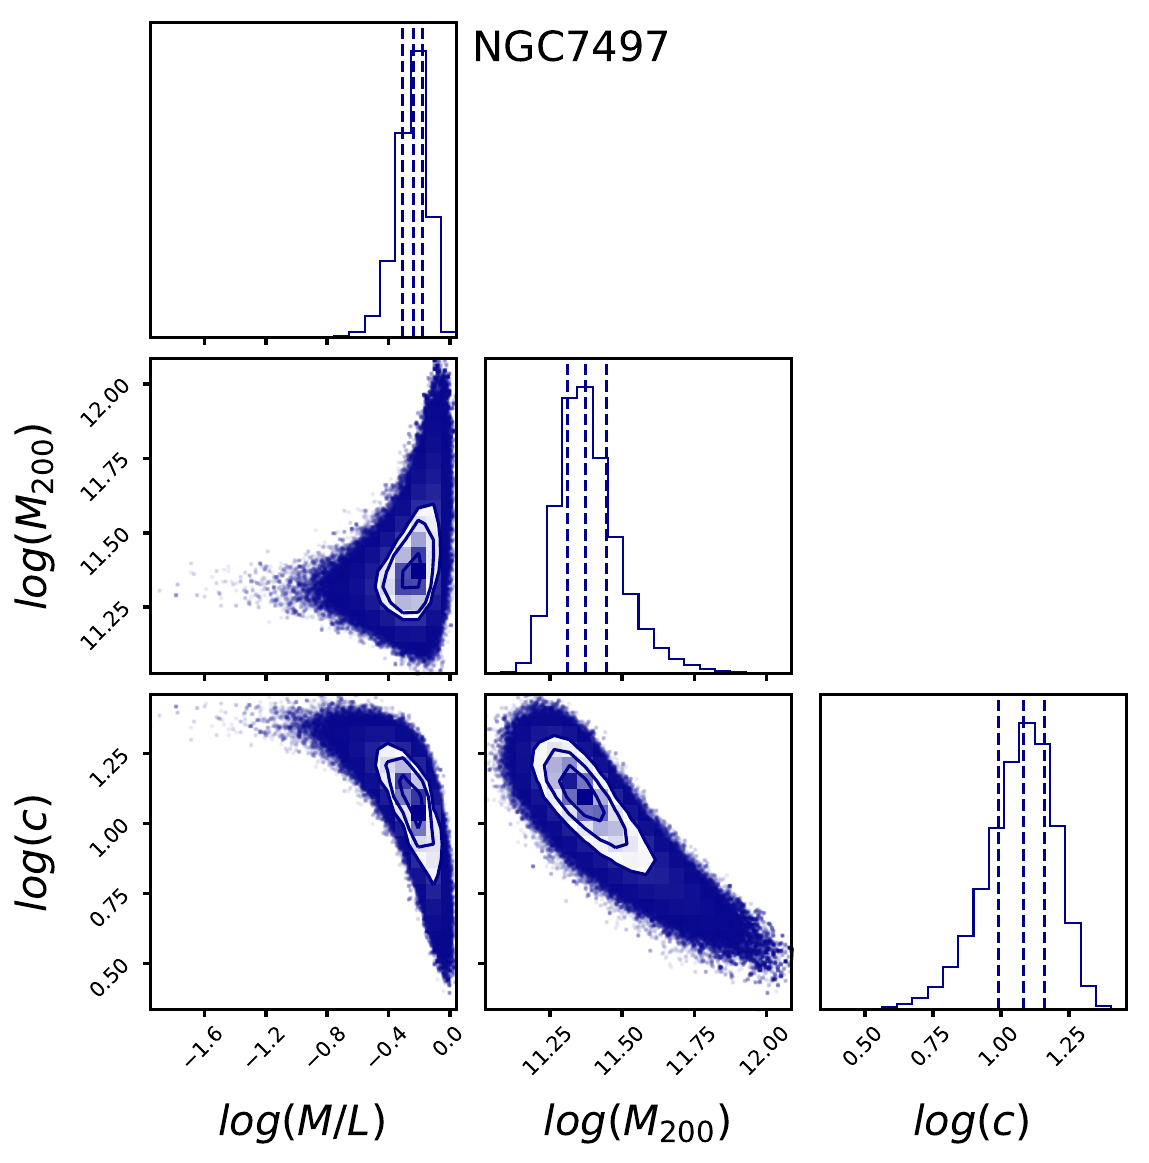
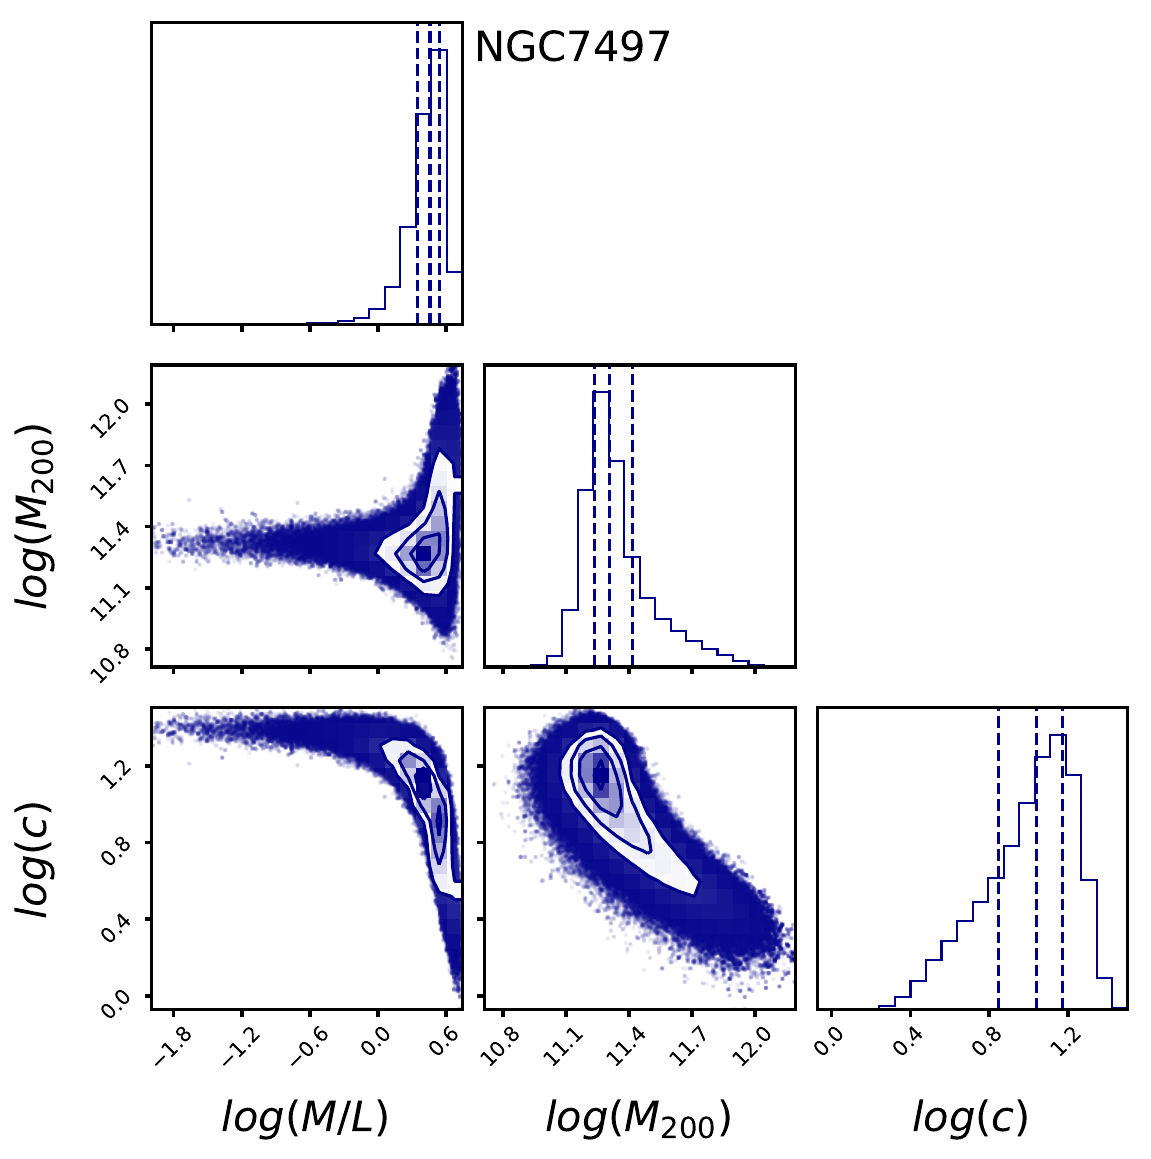
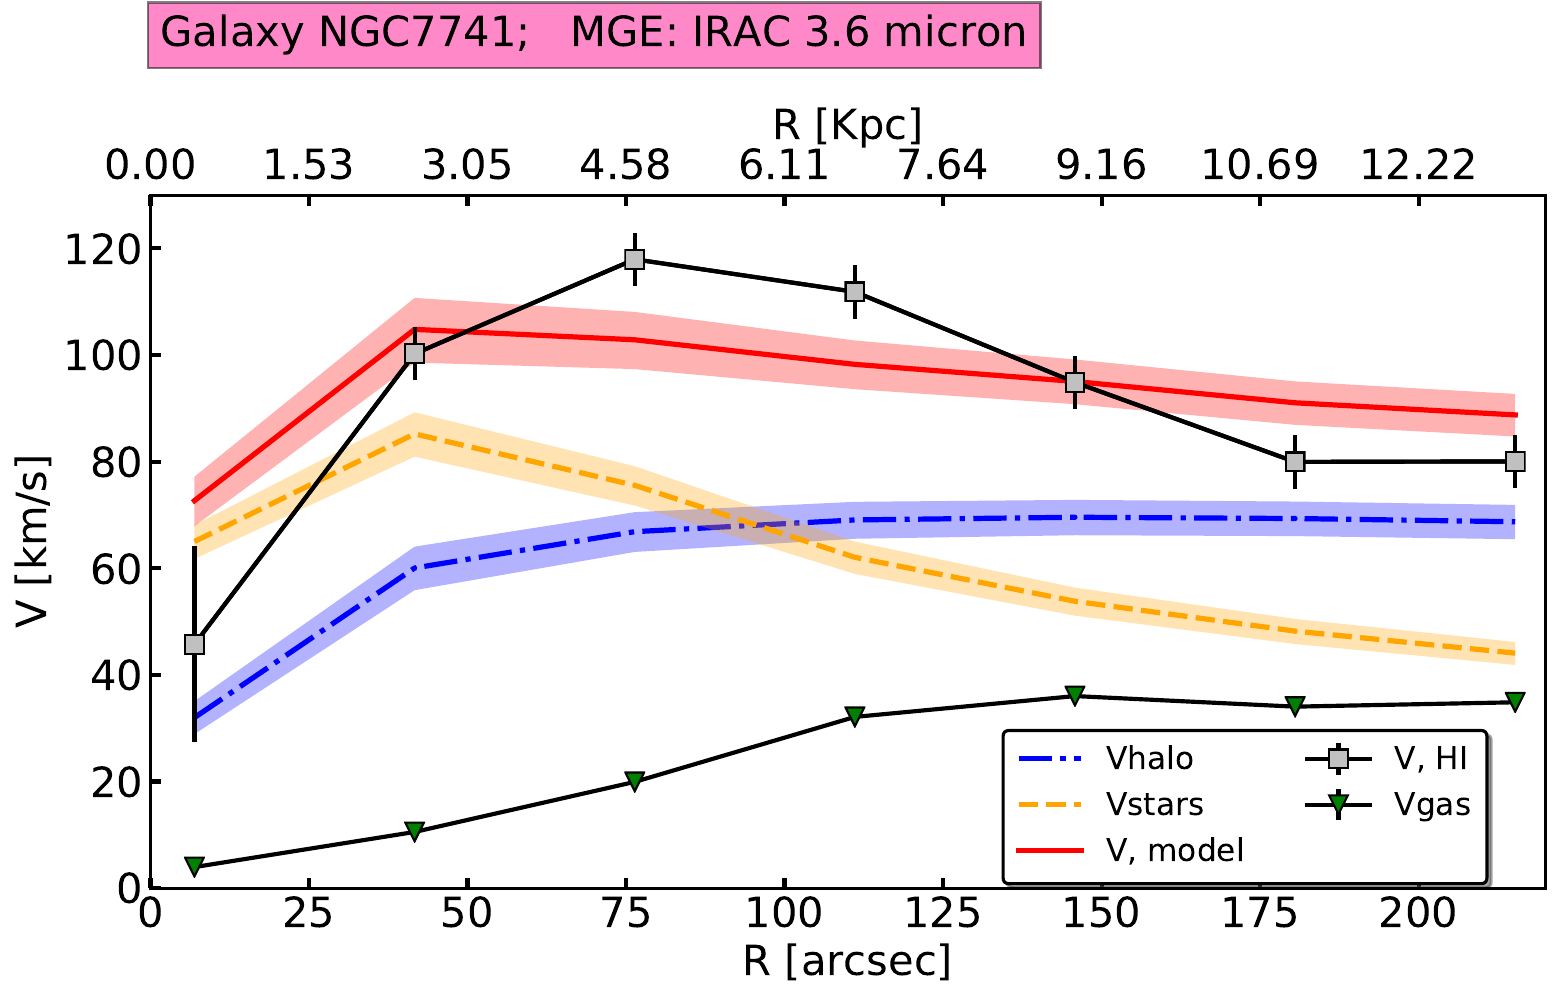
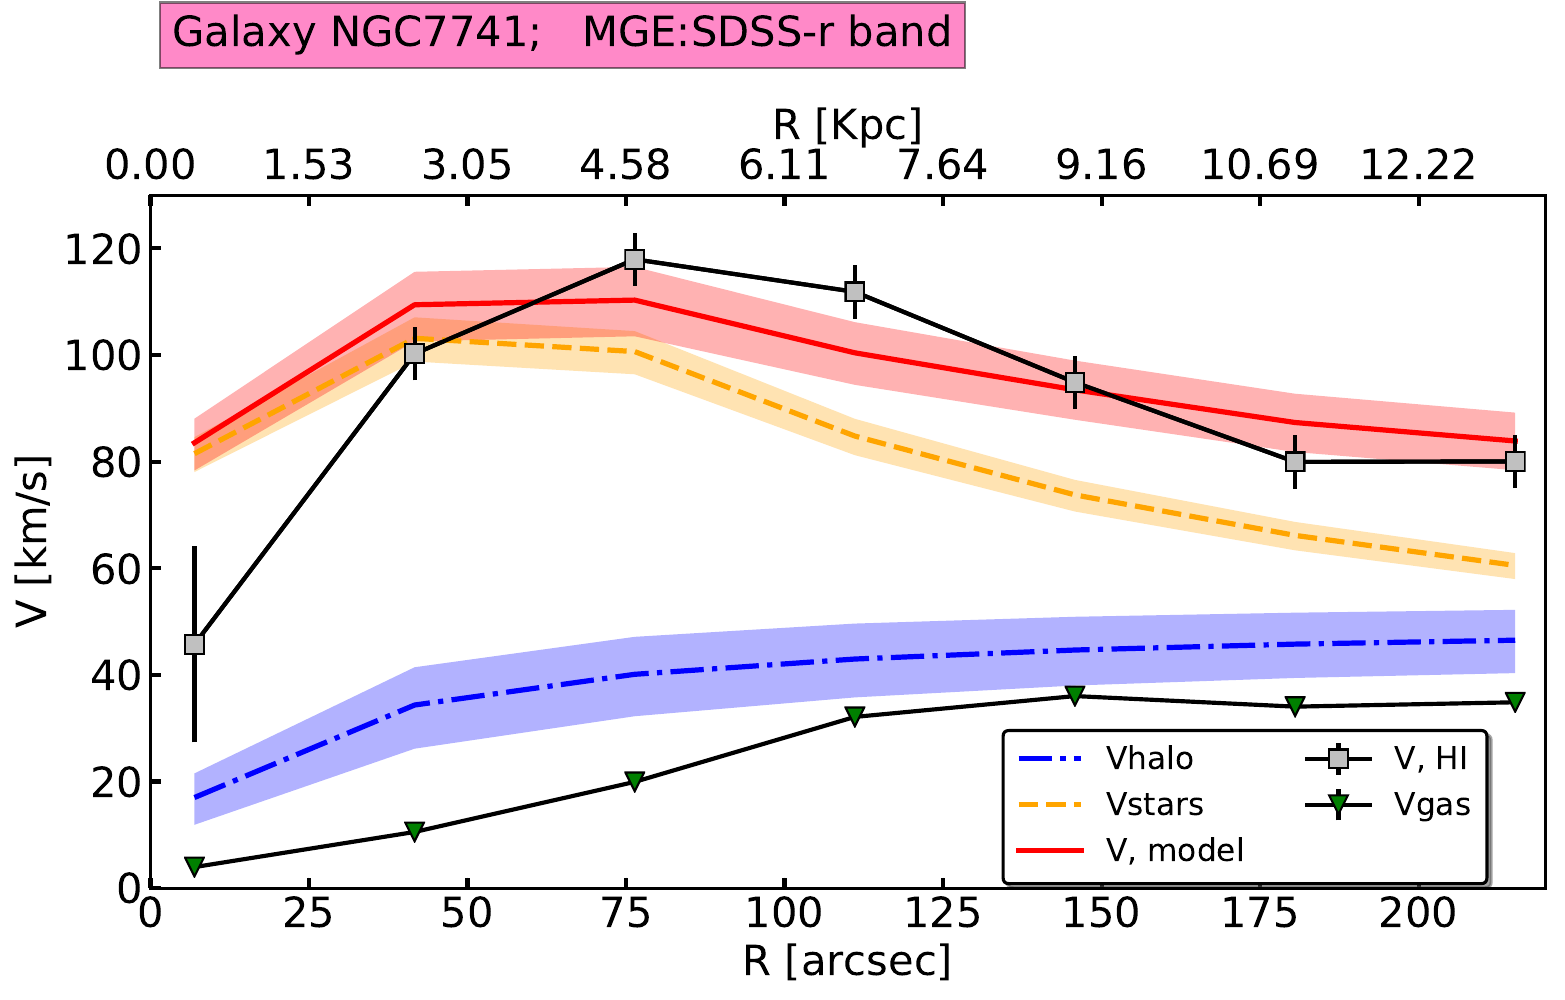
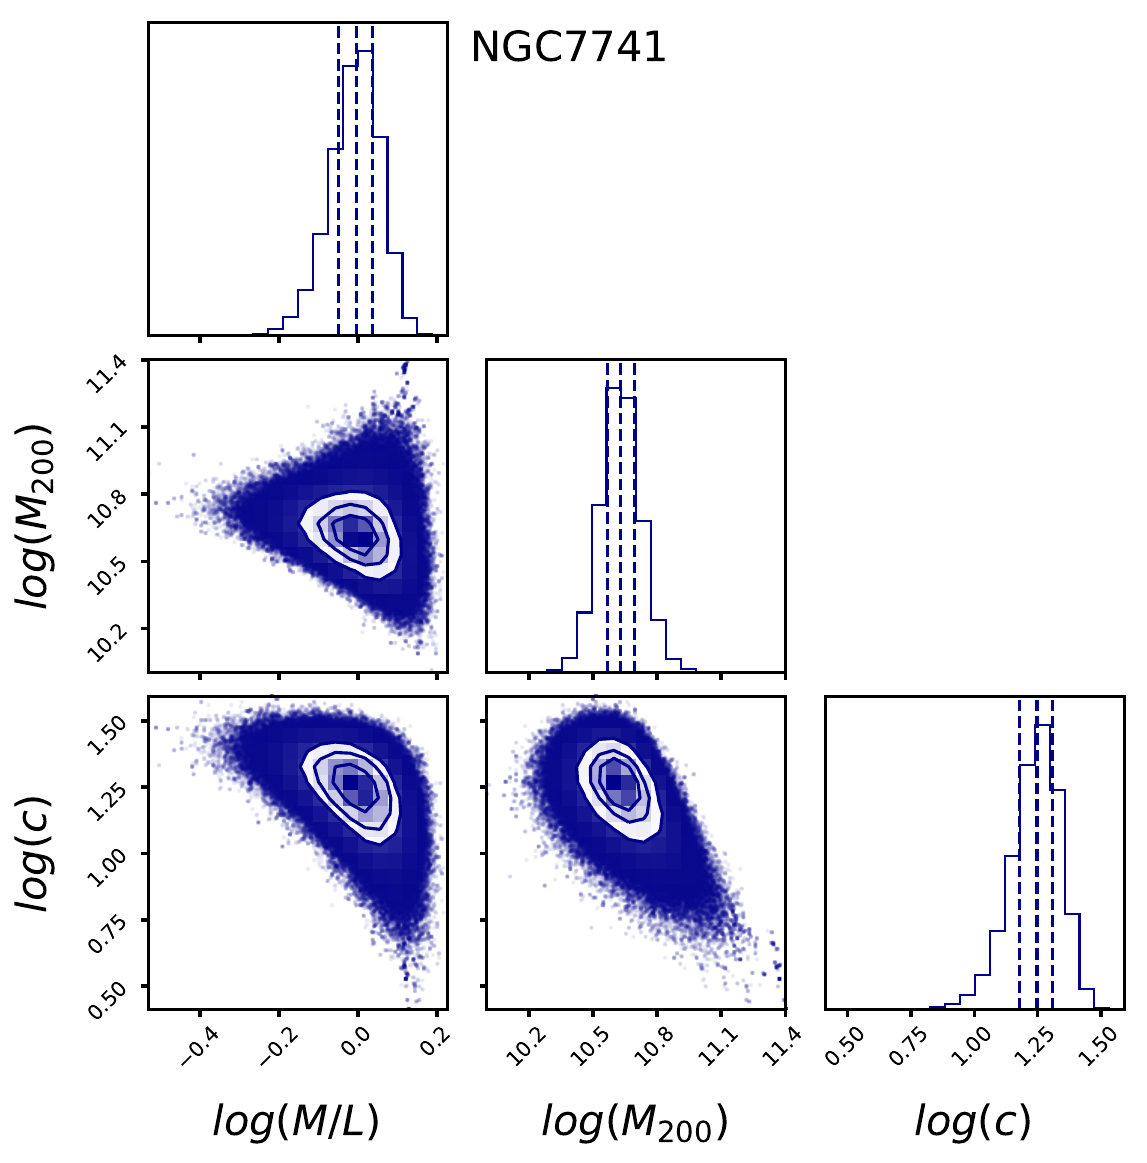
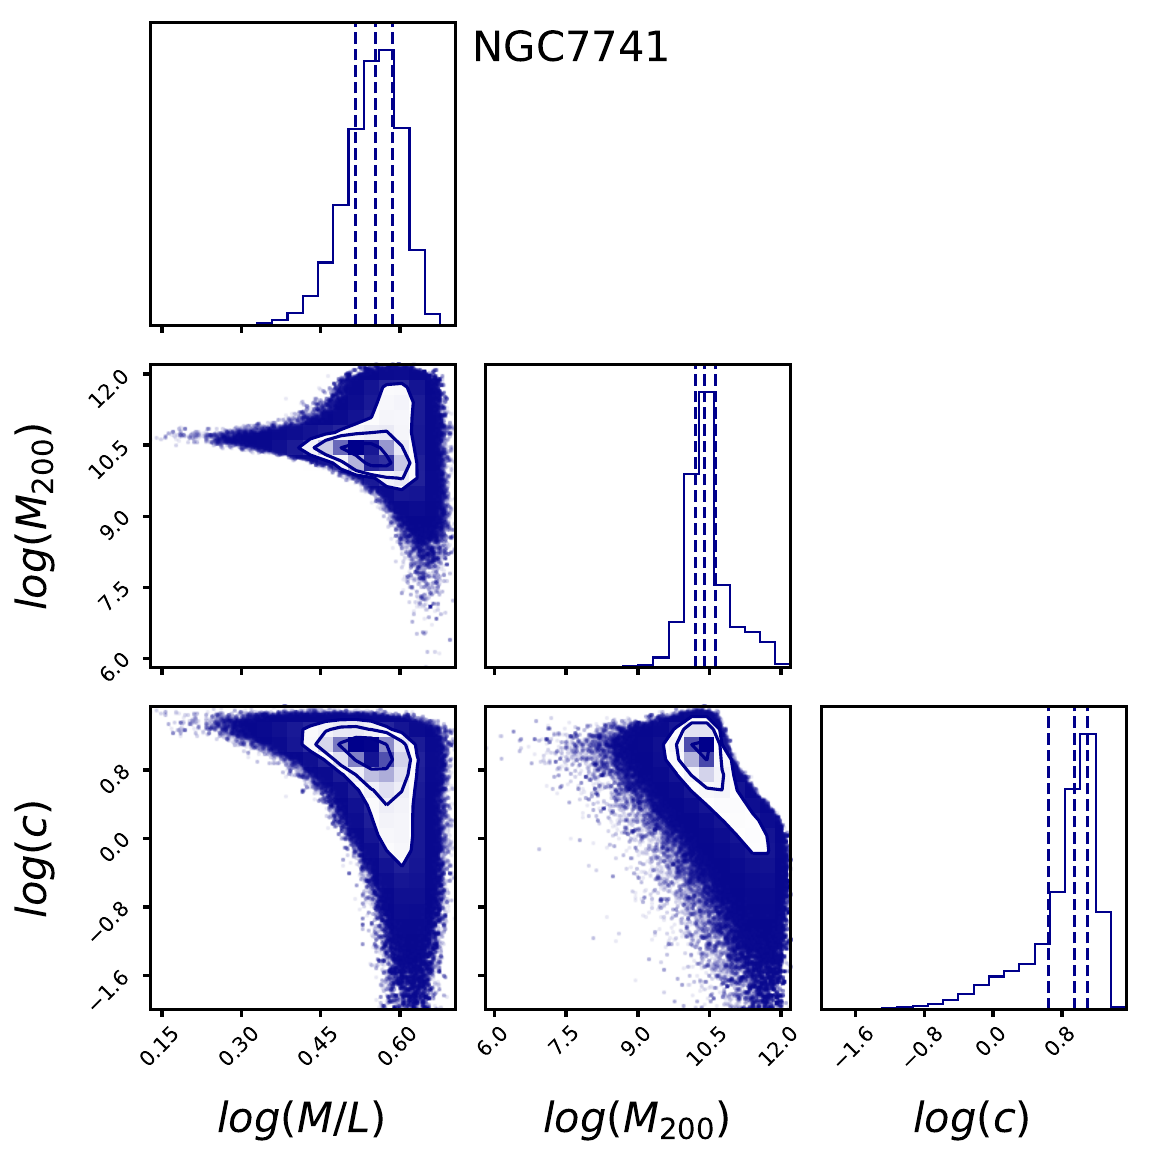
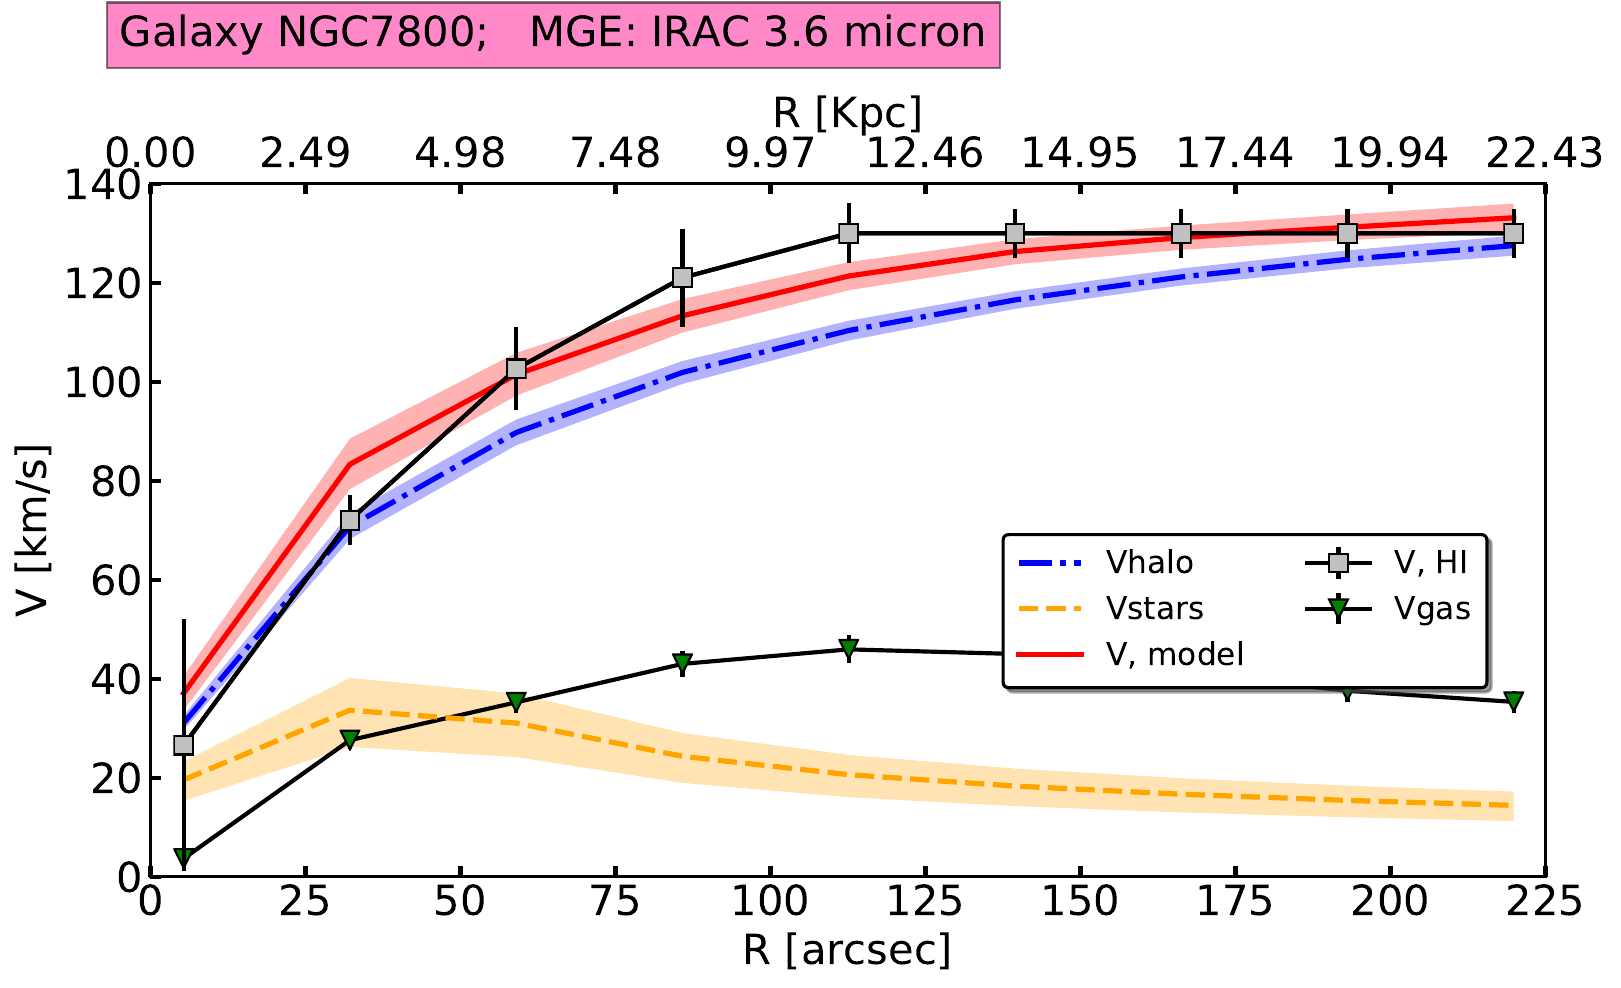
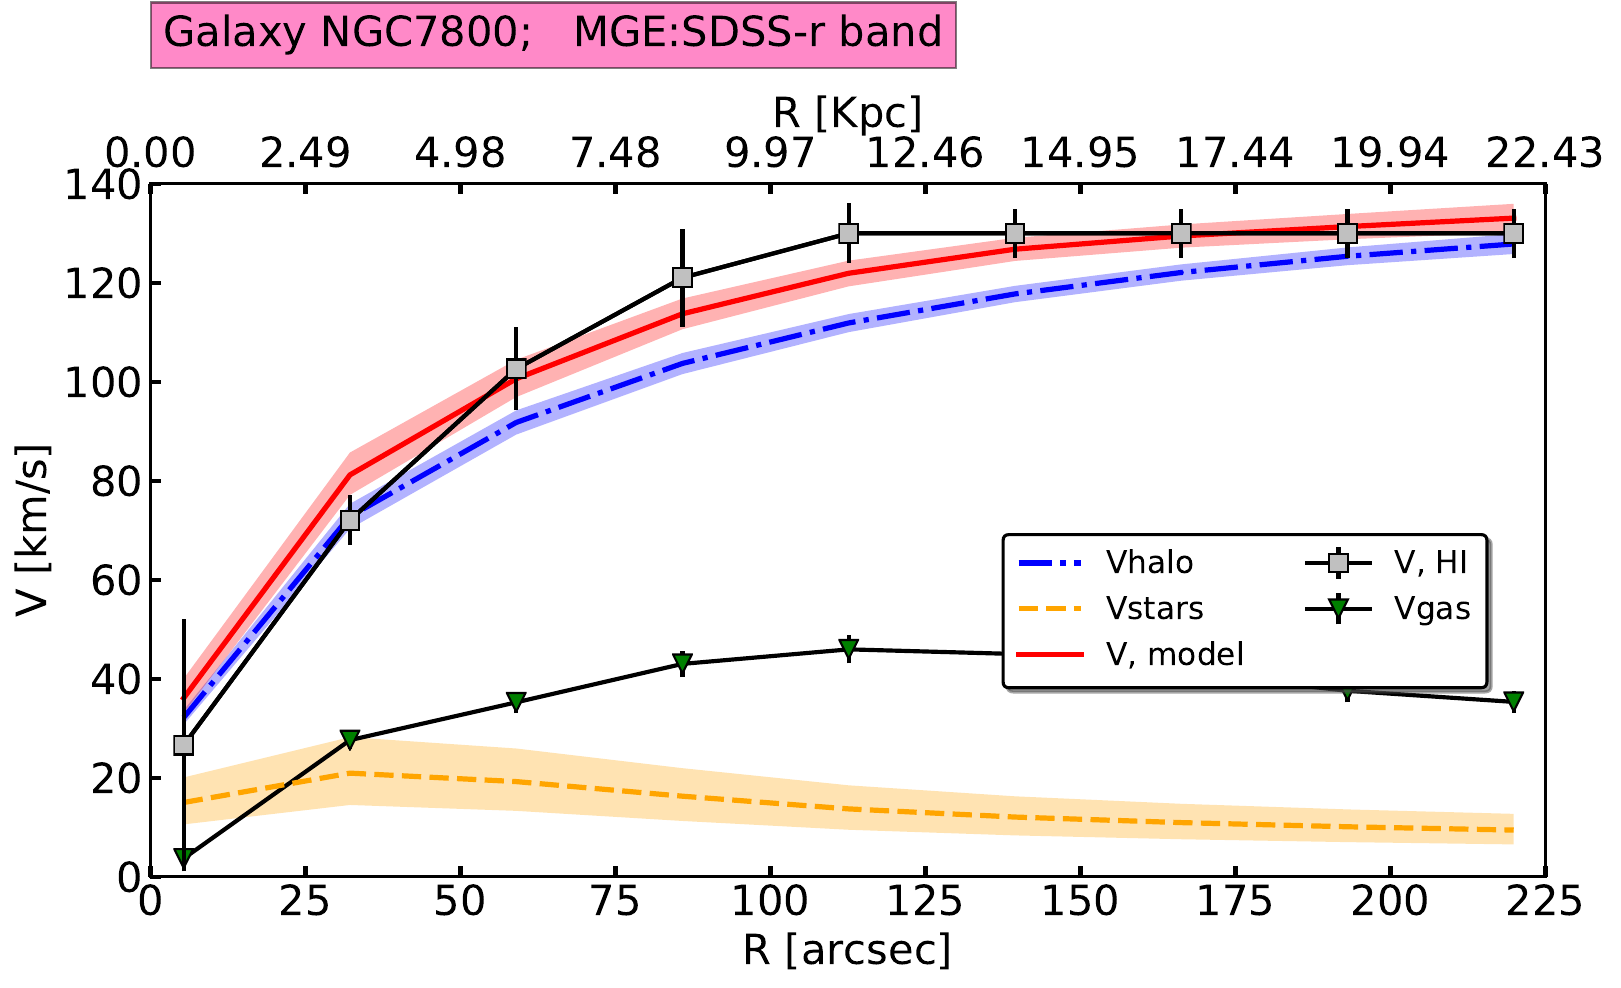
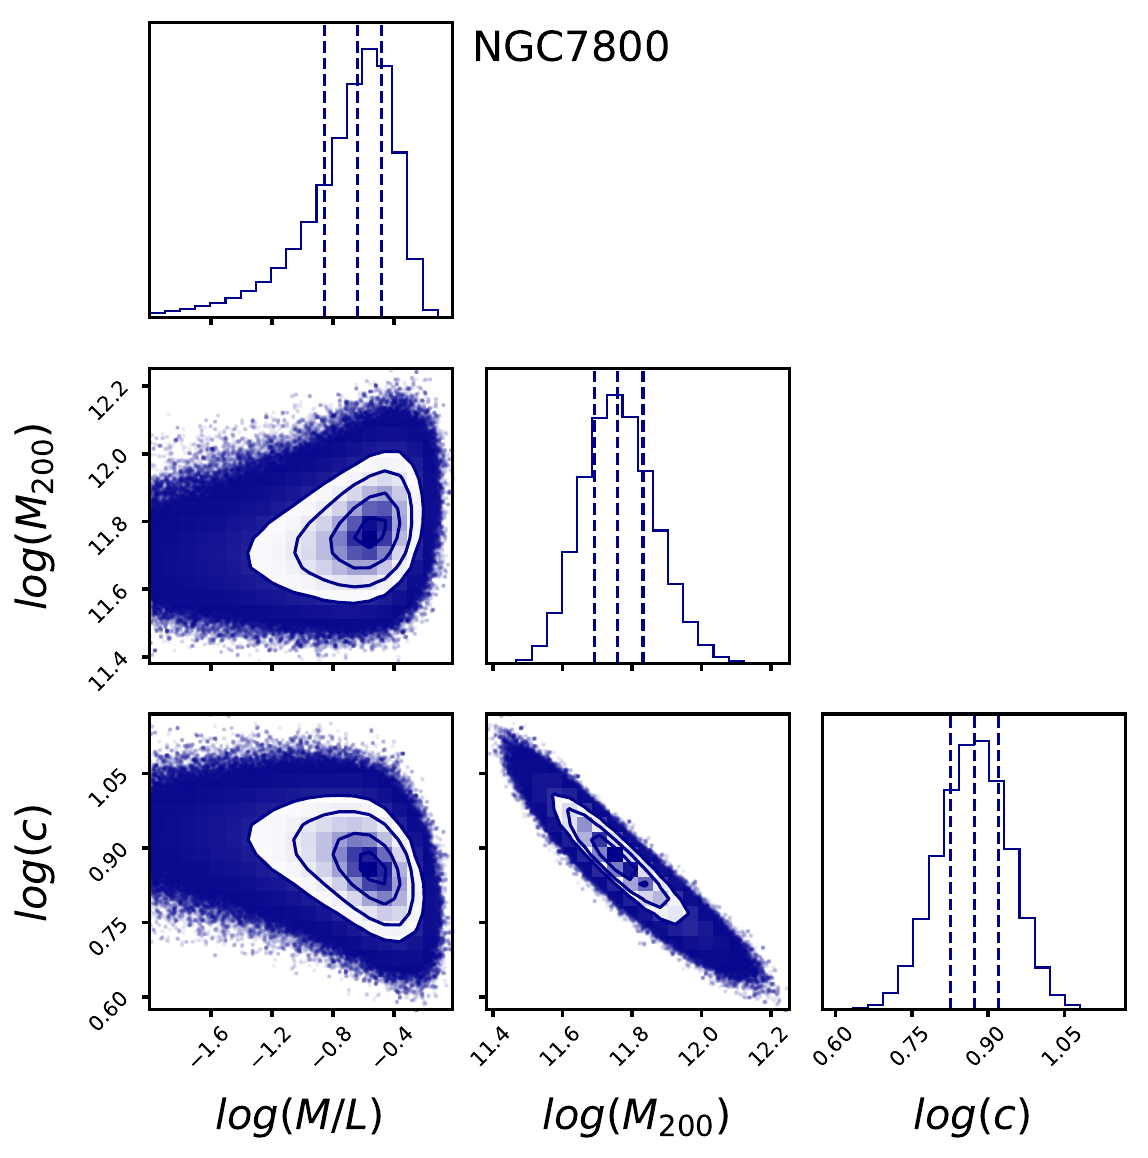
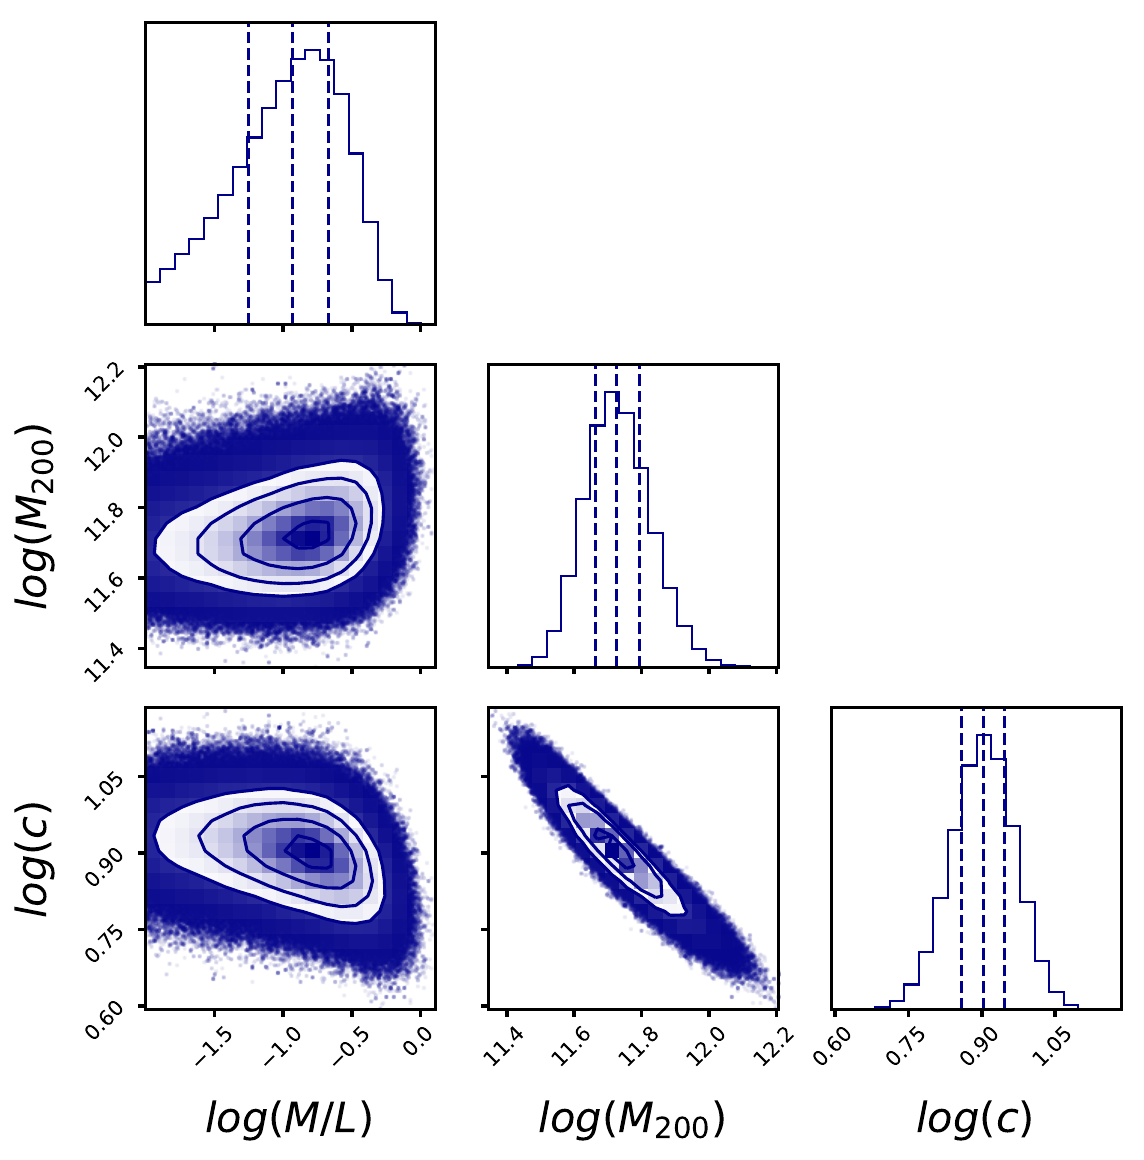
Figure 1 shows the mass modelling done for all the sources separately for 3.6-micron data and r-band data. The posterior distribution of the fitted parameters for each of the modelling is shown just below the modelled curves.
The surface brightness of the galaxies can be found here.
Figure 1: Modelled rotation curve along with the contribution of from star, gas and halo mass of different sources. The posterior distribution of different parameters used for modelling is shown below for each modelled rotation curve.
----------------------------------------
----------------------------------------
----------------------------------------
----------------------------------------
----------------------------------------
----------------------------------------
----------------------------------------
----------------------------------------
----------------------------------------
Surface brightness
The surface brightness of the