Pilot Sample
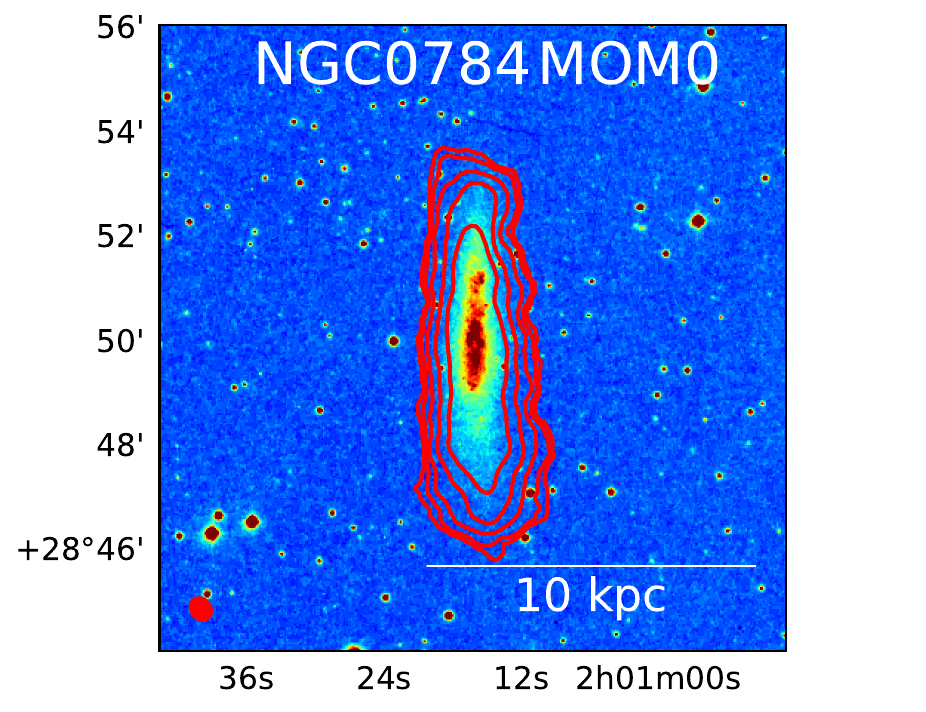
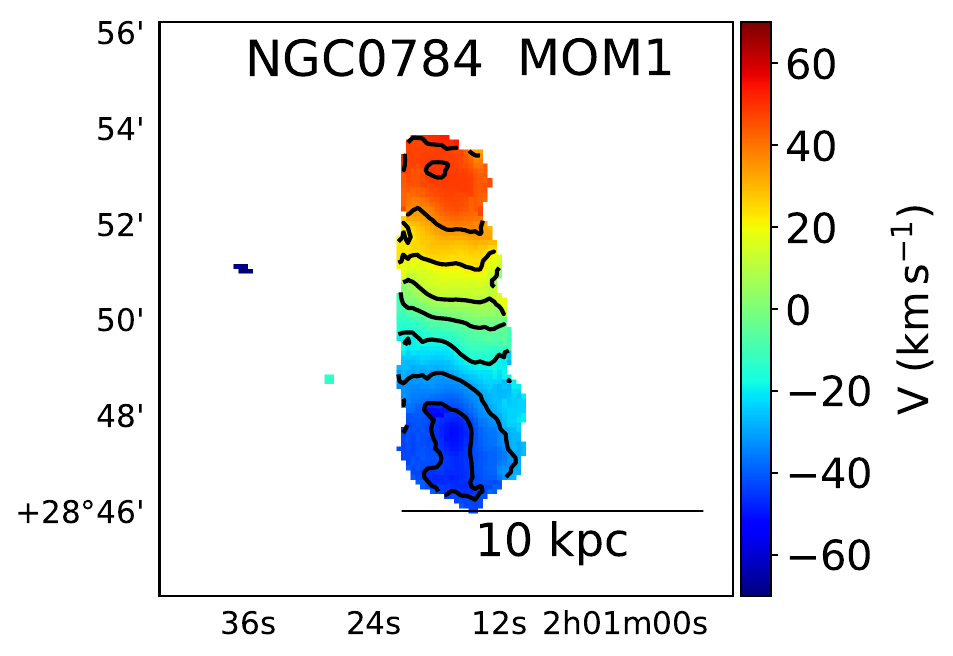
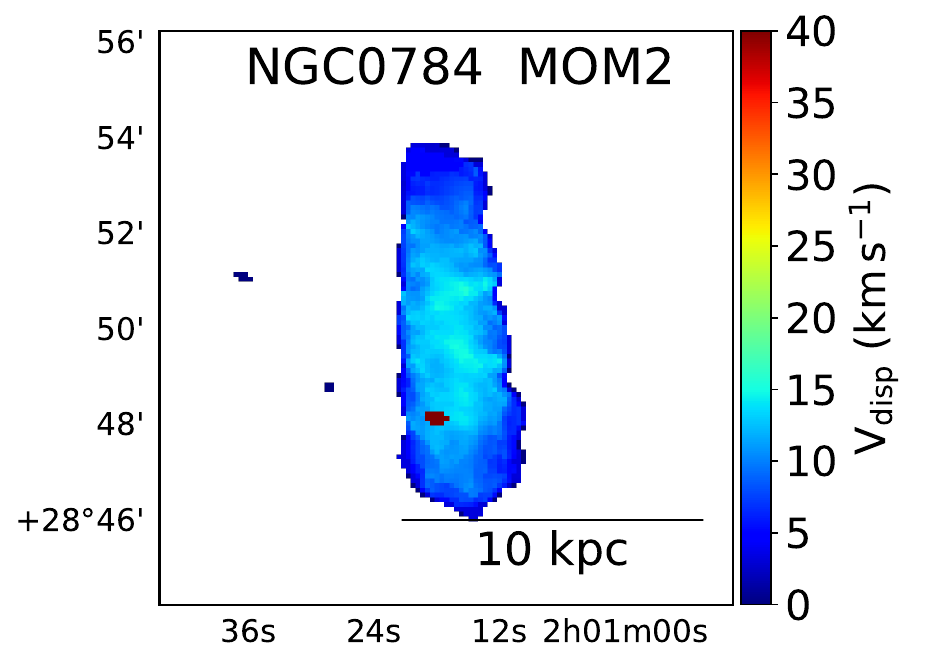
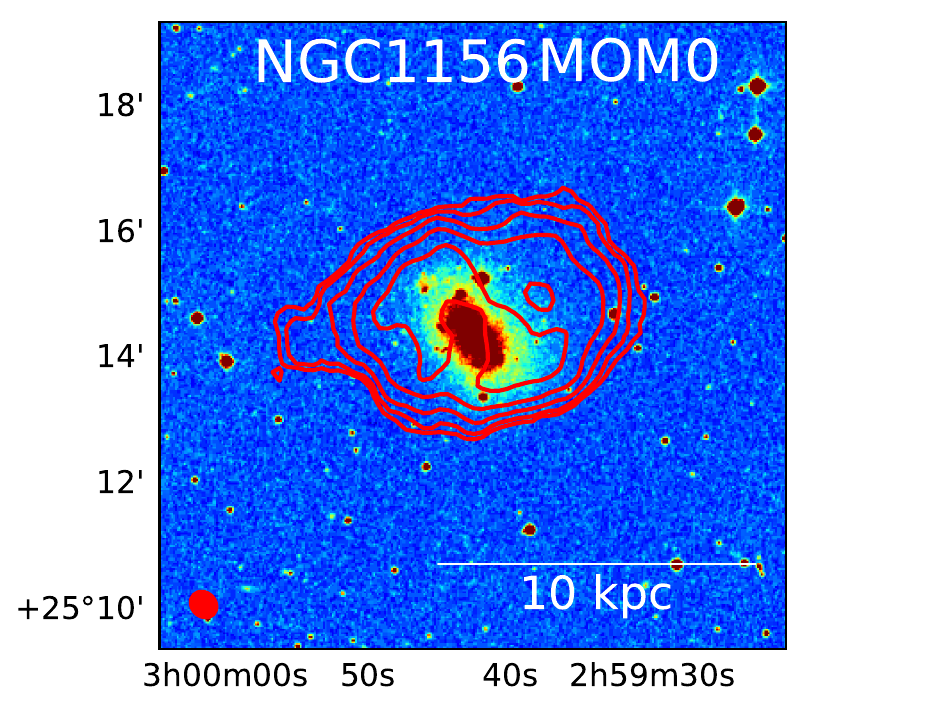
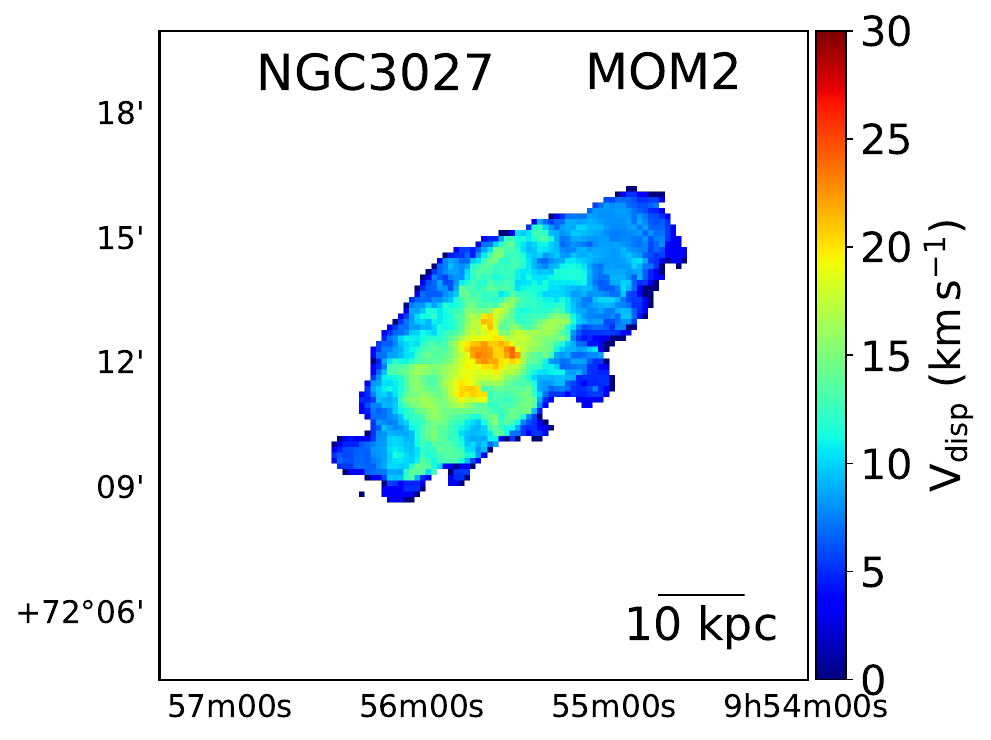
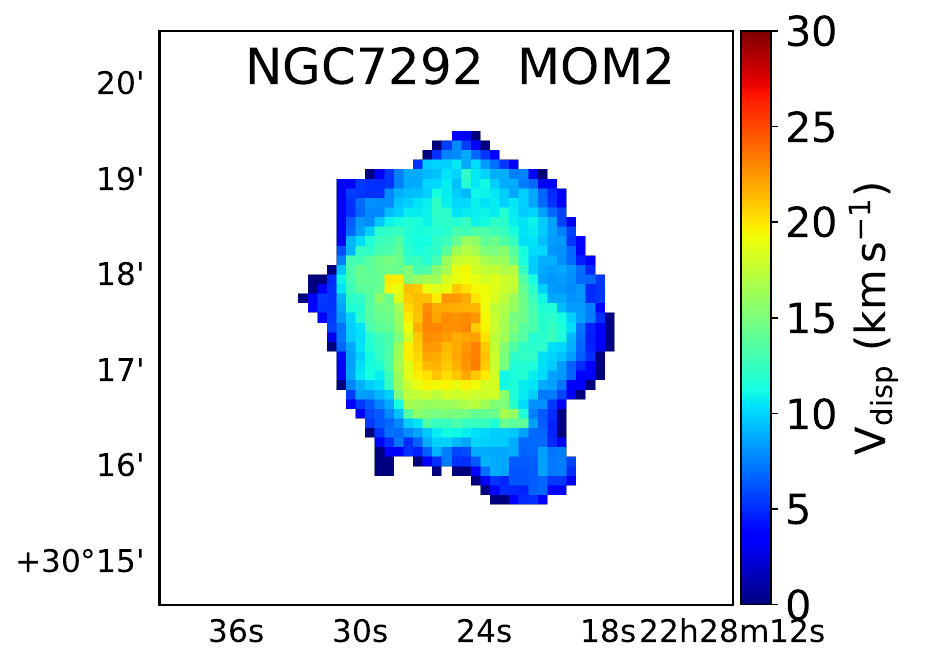
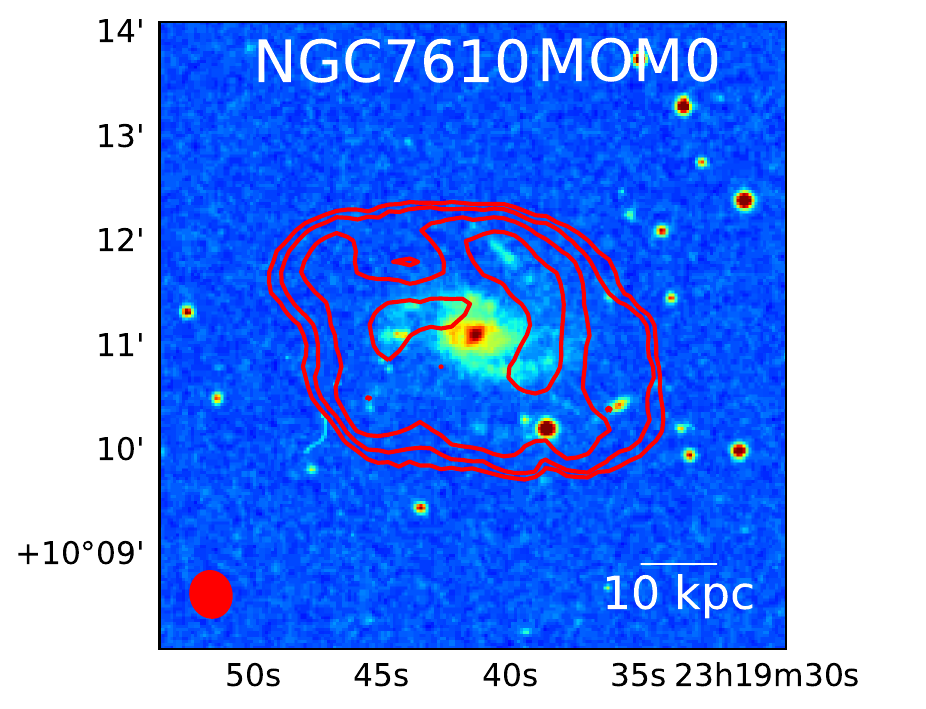
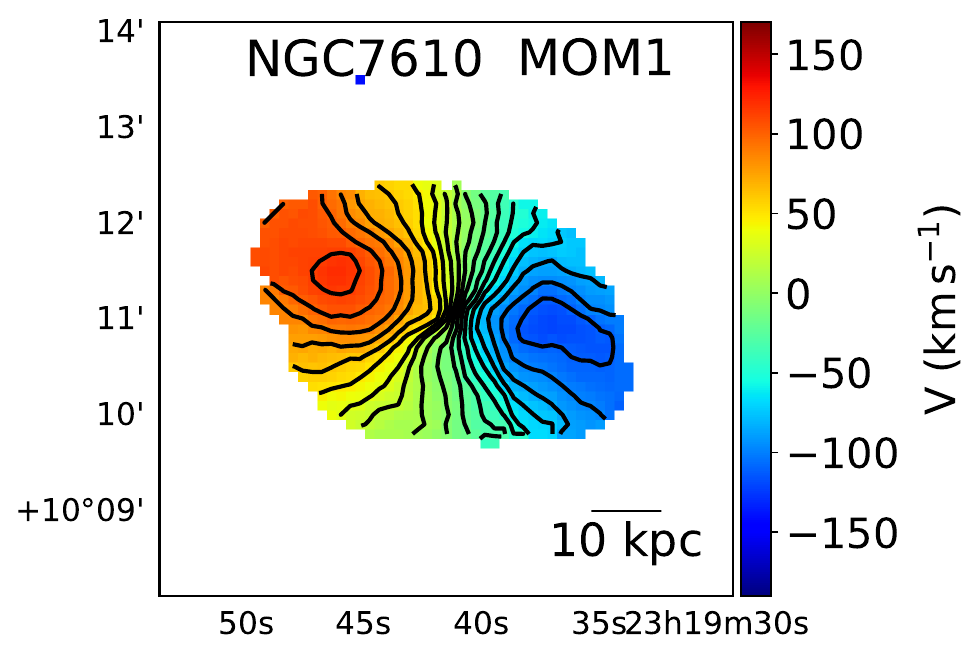
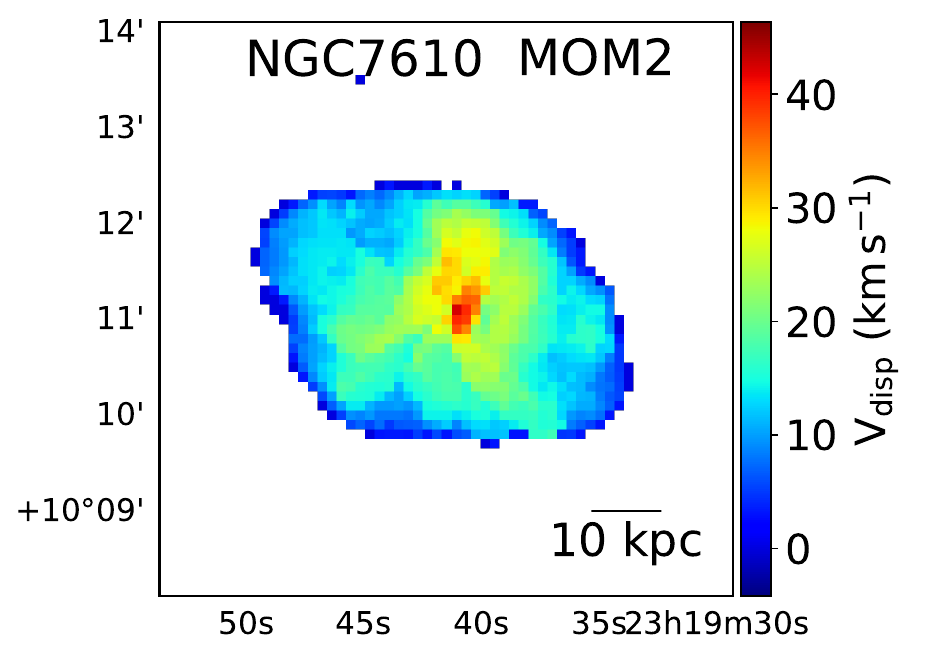
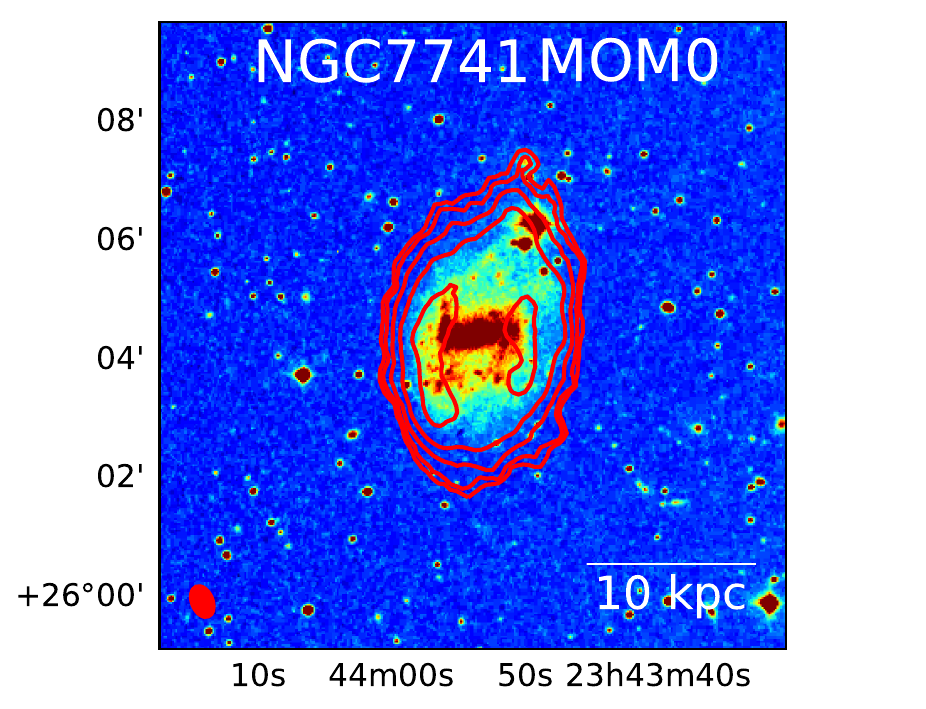
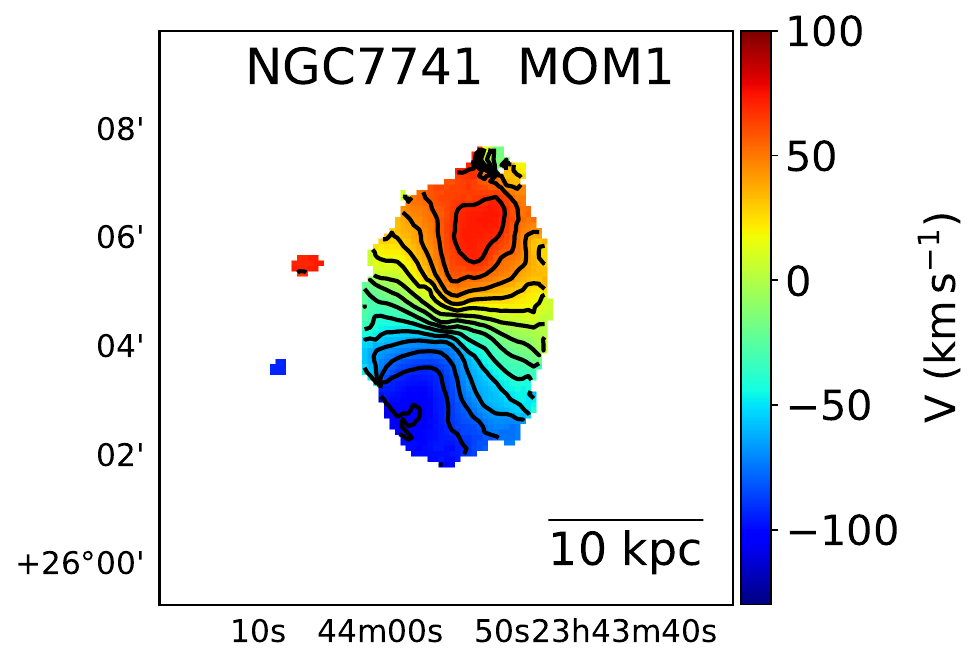
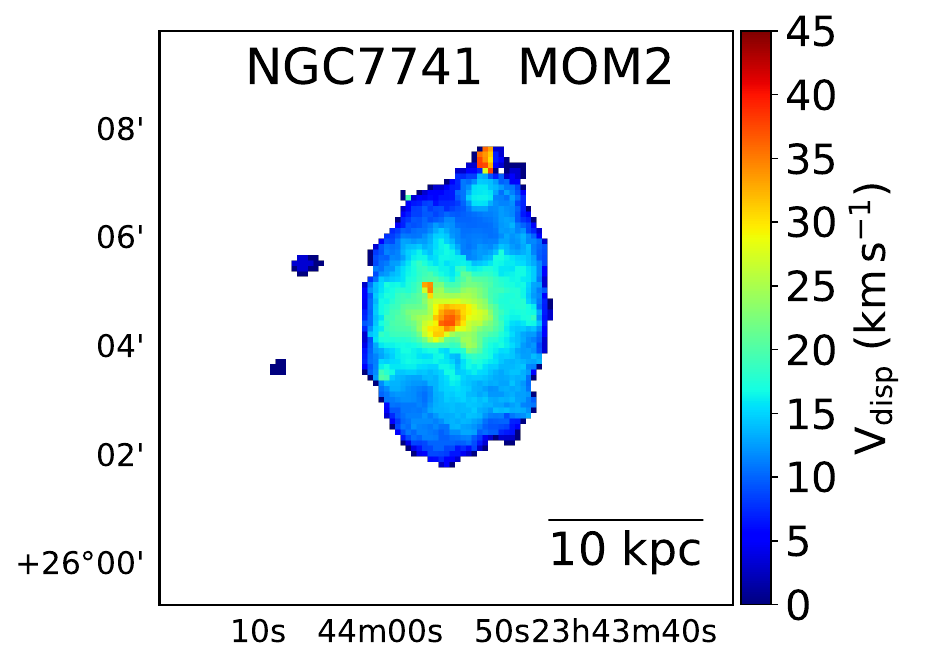
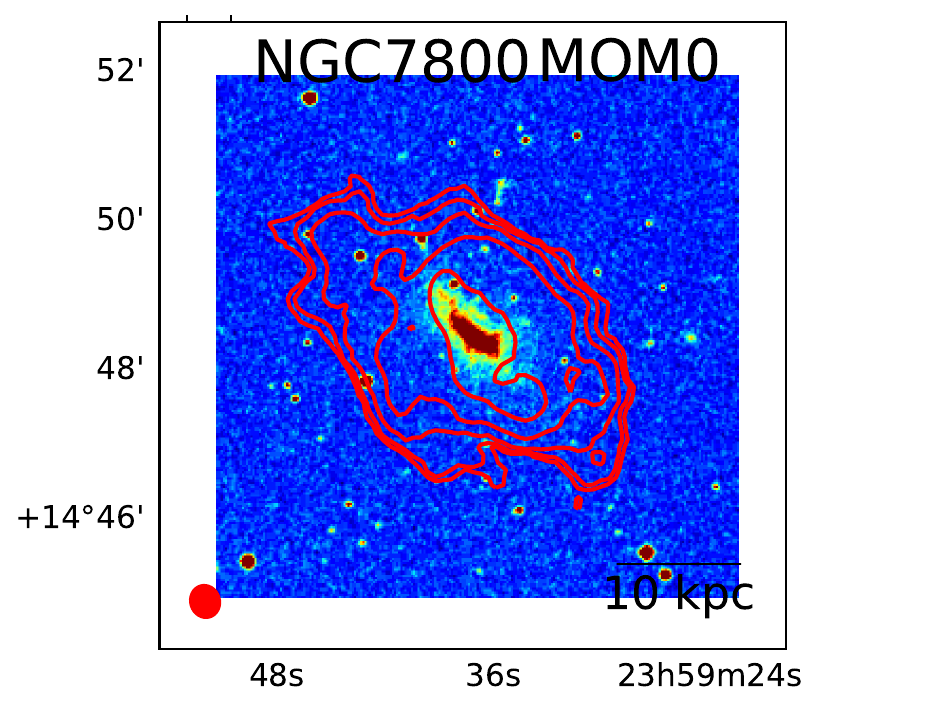
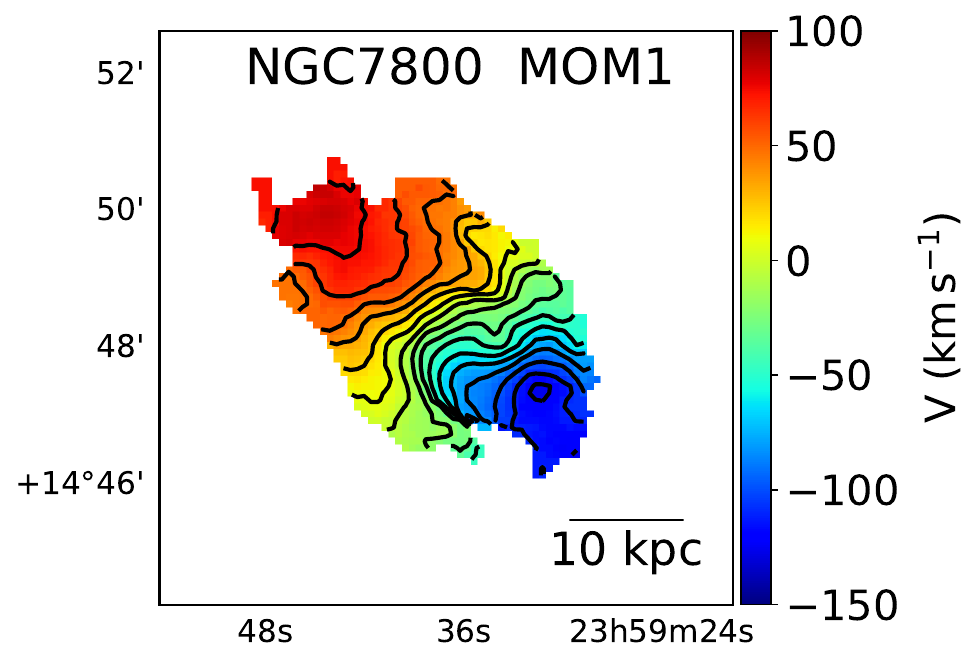
The GARCIA pilot sample contains eleven galaxies. For these sources, we have uniformly analyzed the data; the details of the data analysis procedure can be found in paper-I . The detail properties of these pilot sample is shown in Table 2 of paper-I . Here we present the moment maps of this pilot sample (figure 1).
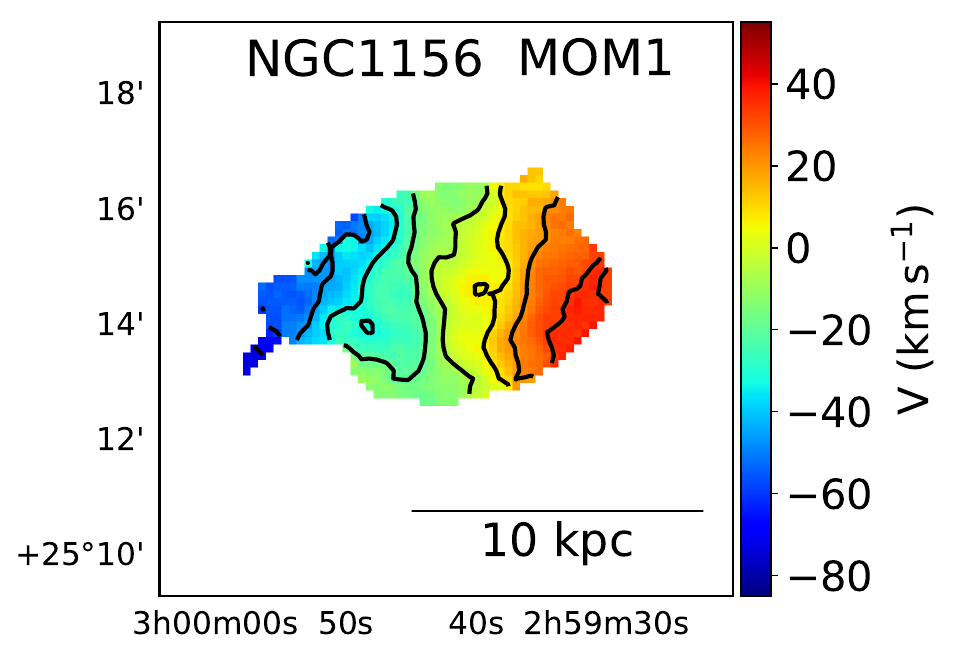
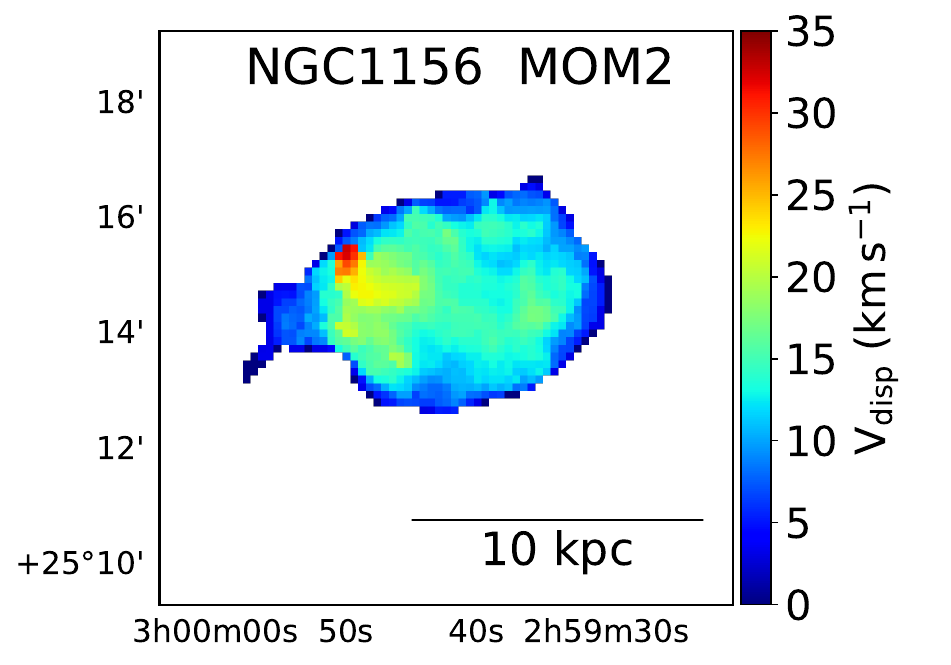
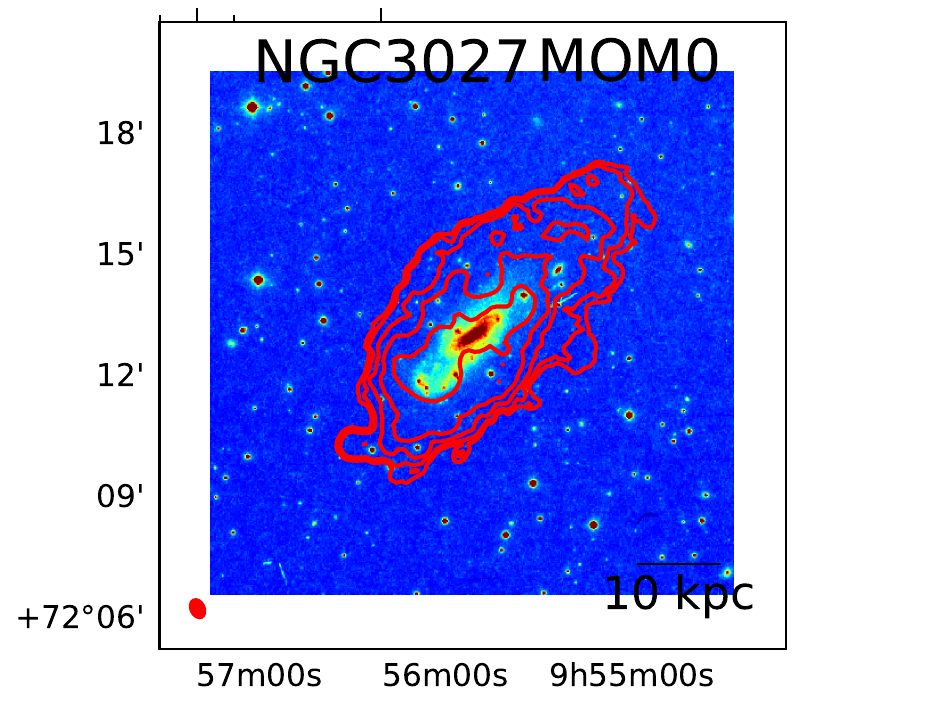
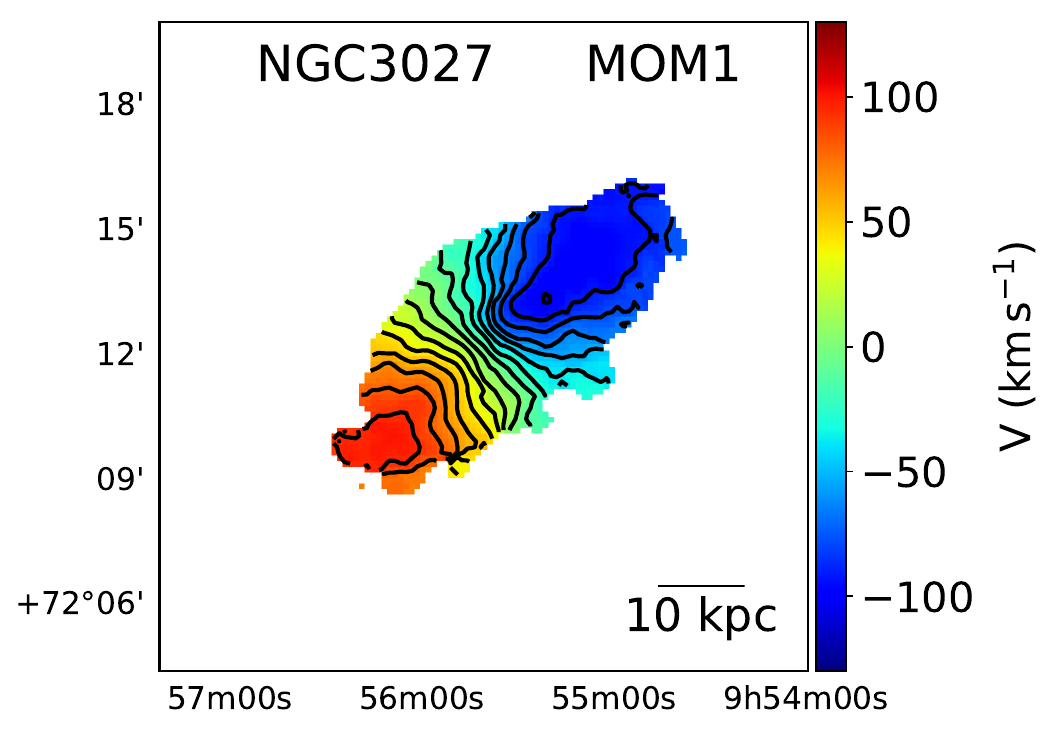
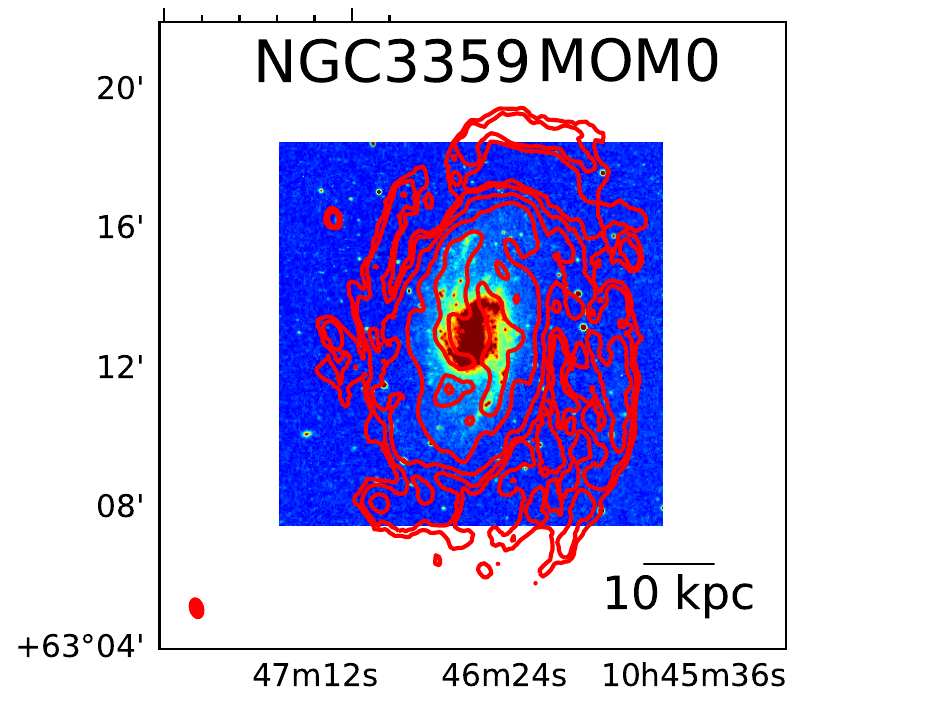
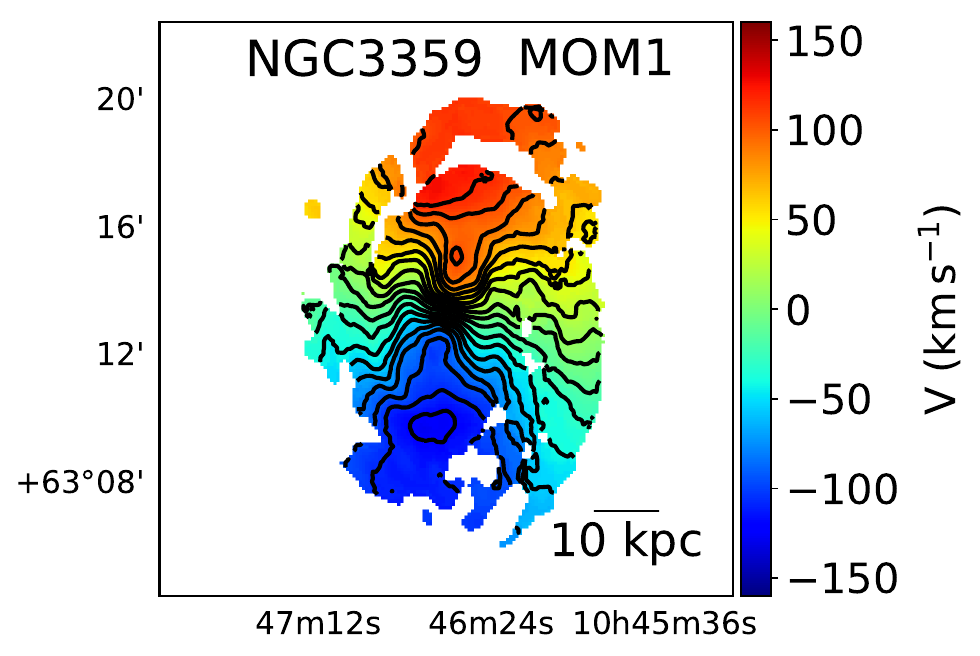
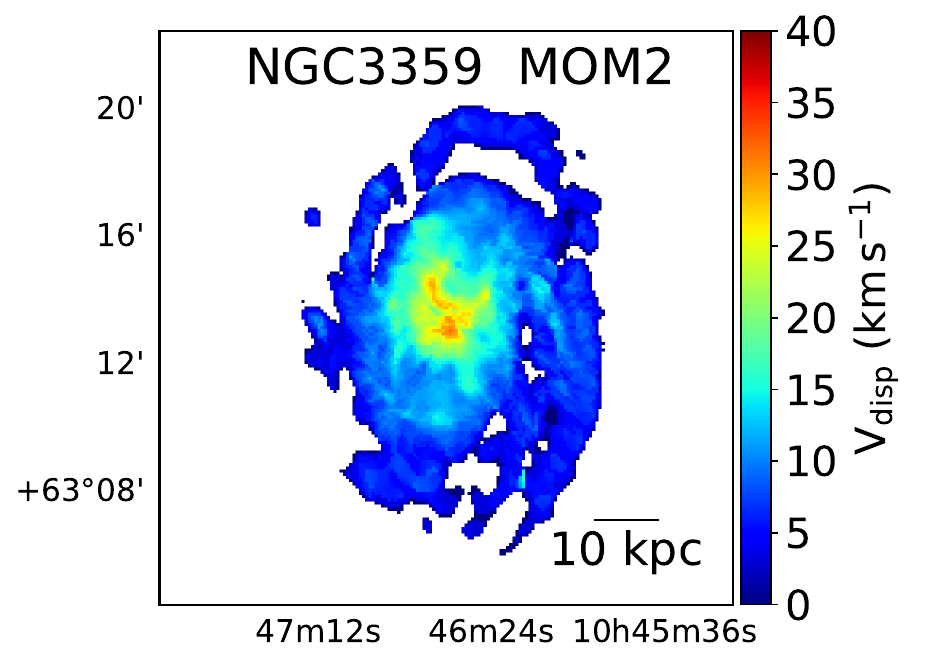
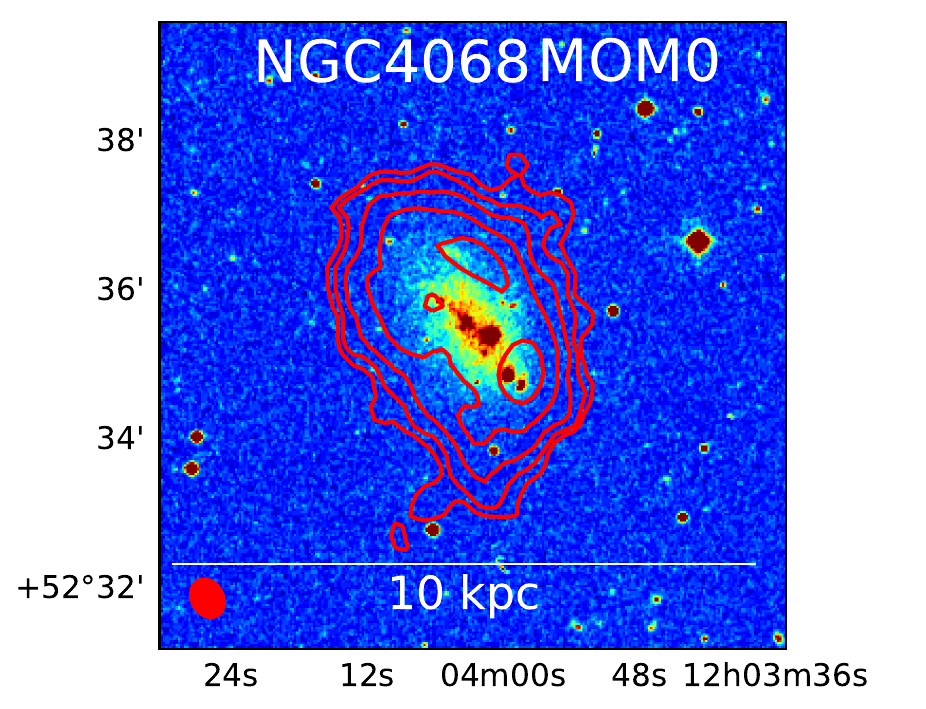
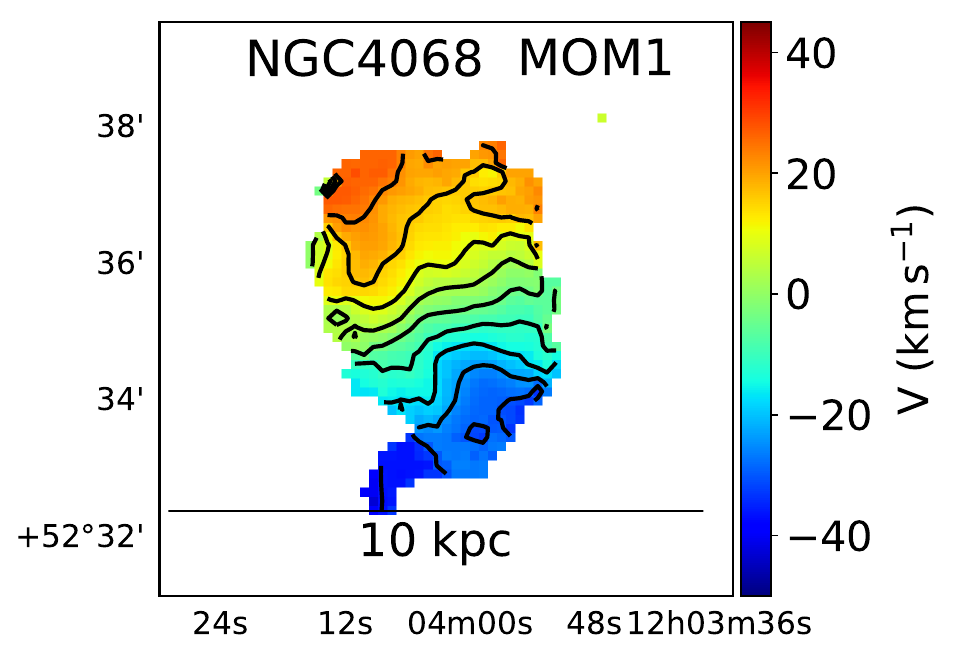
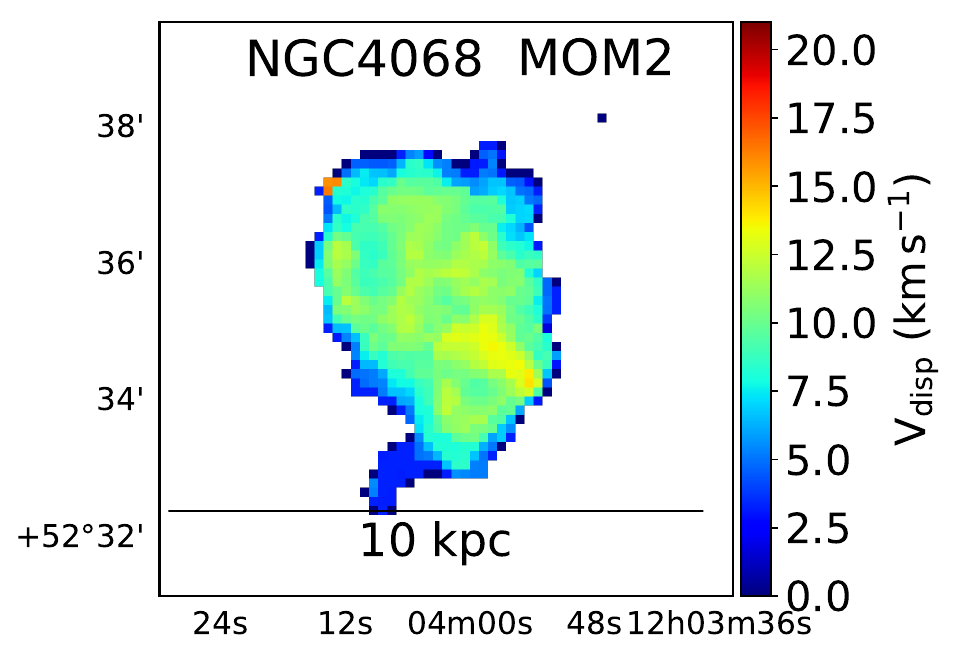
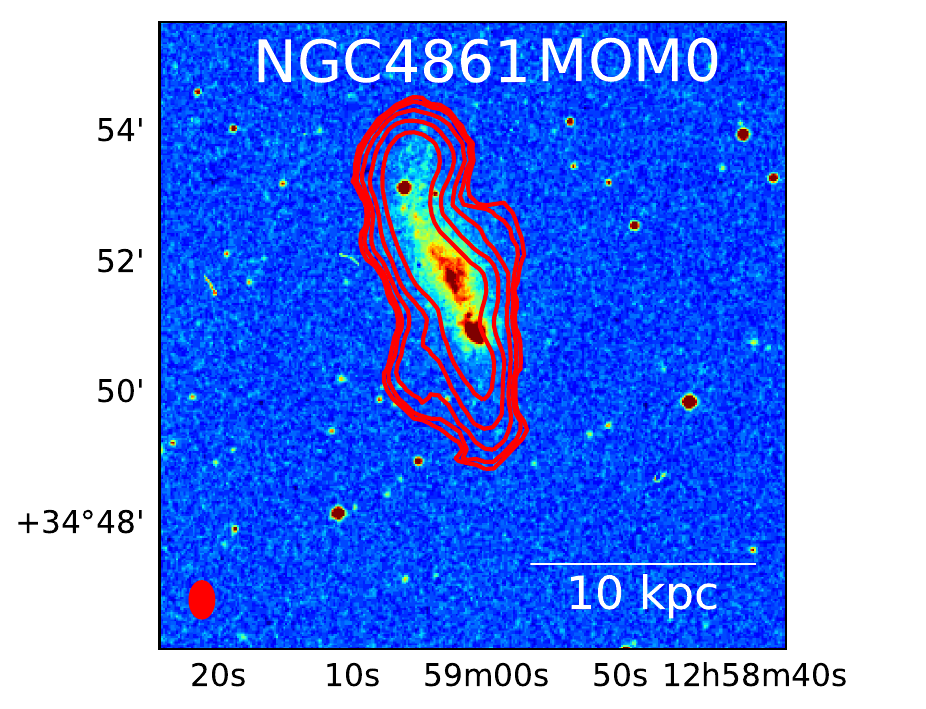
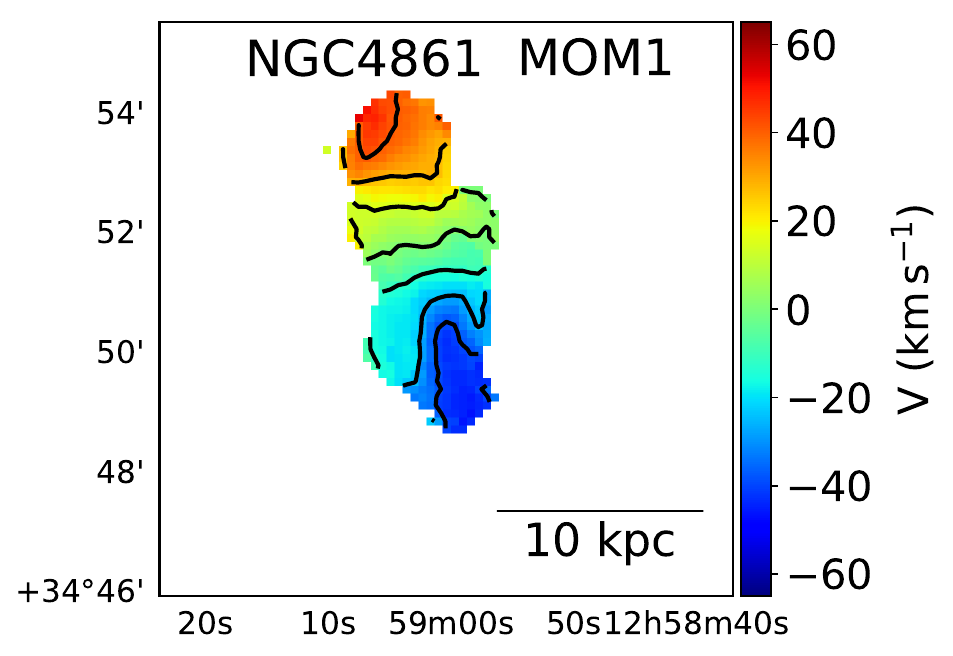
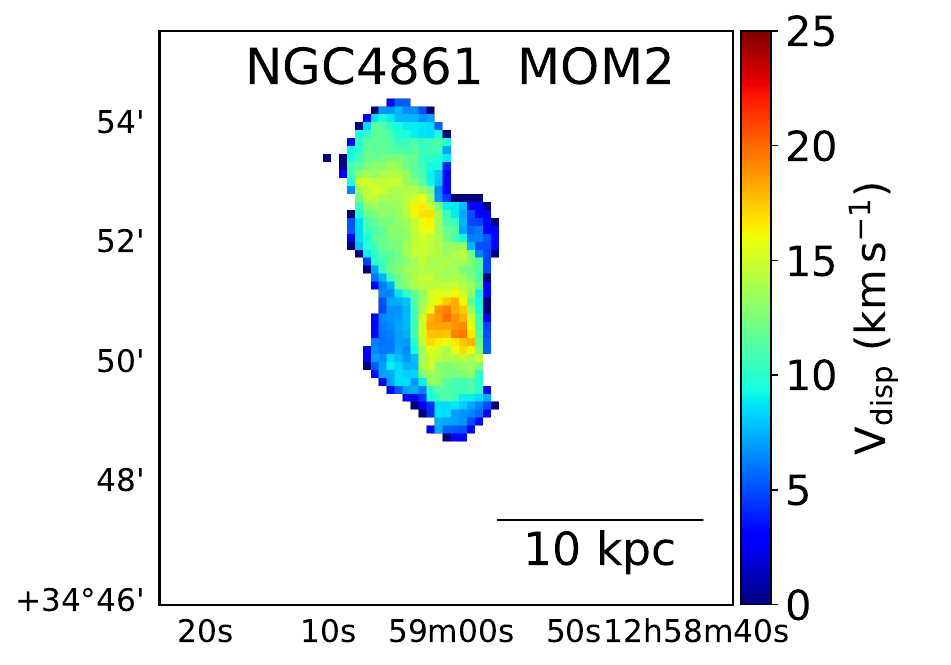
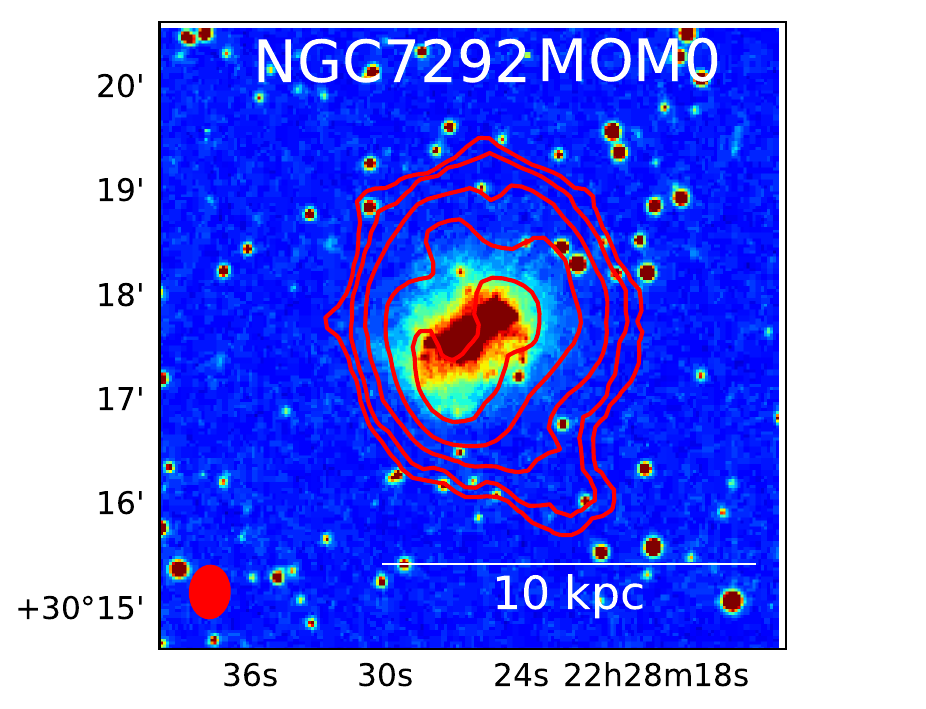
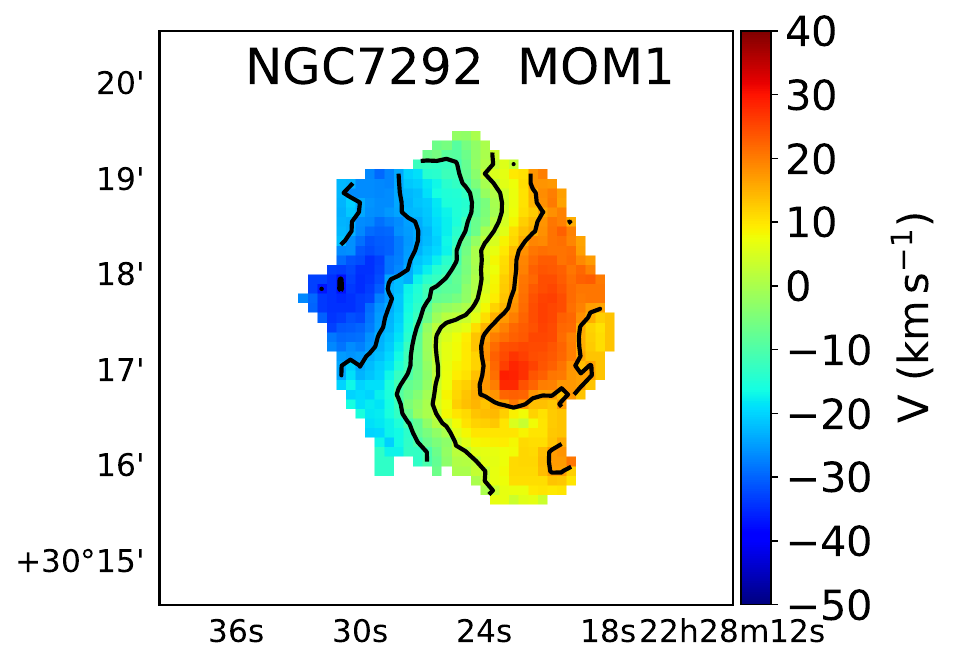
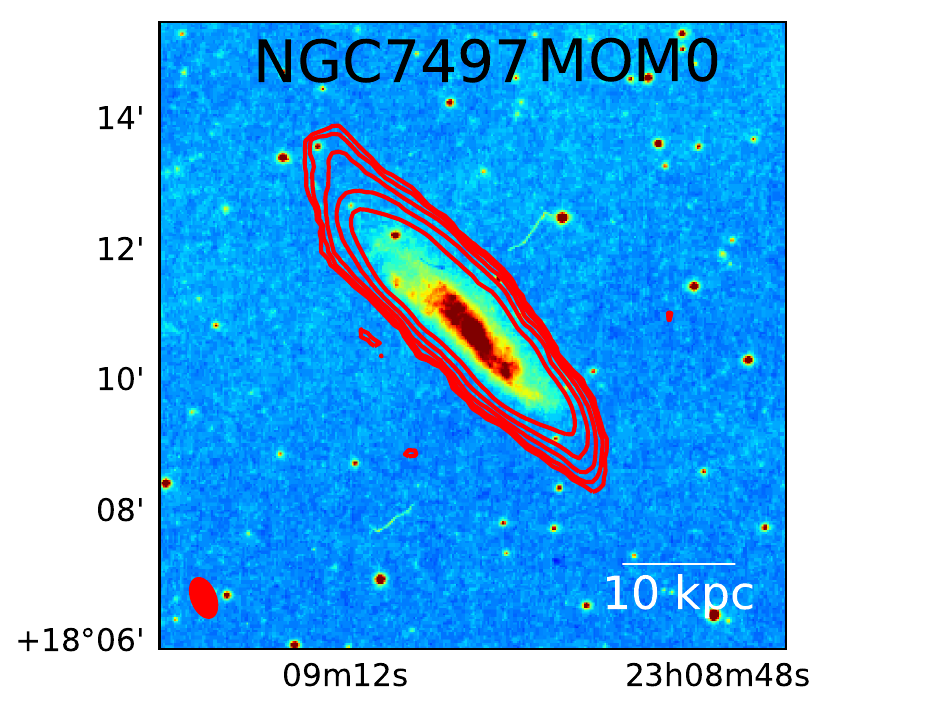
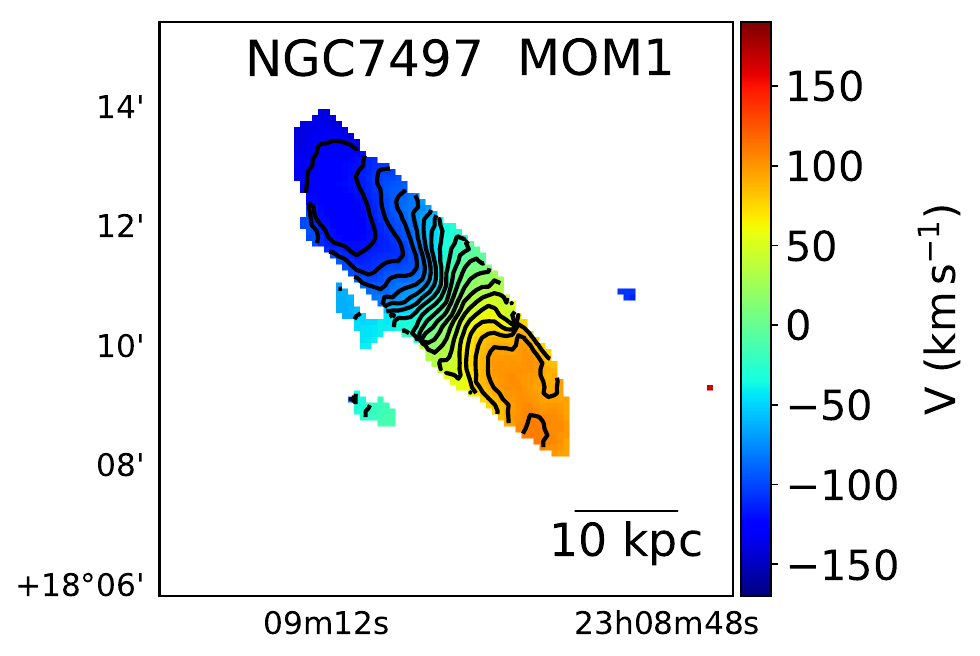
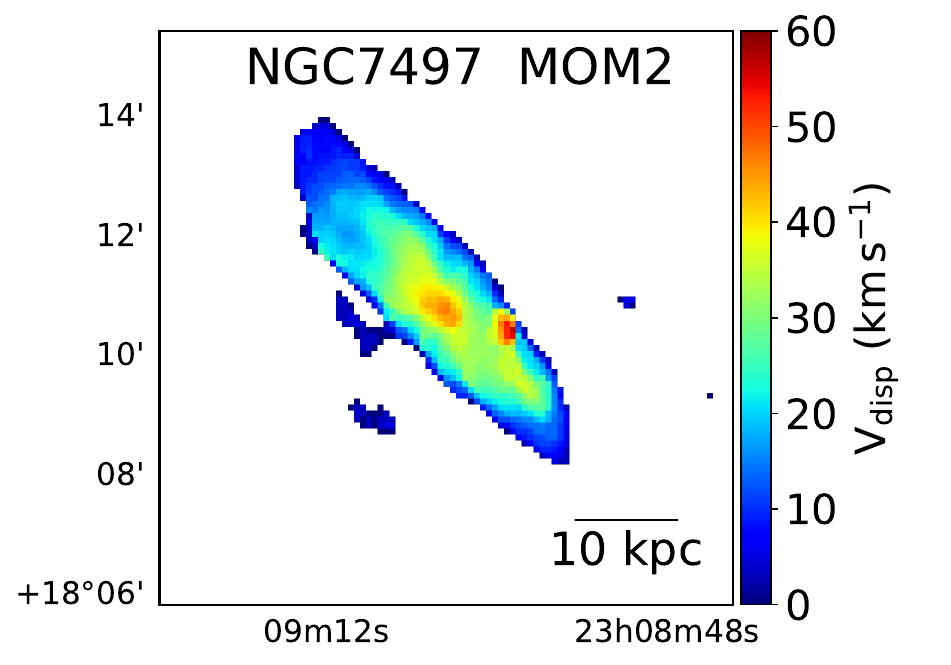
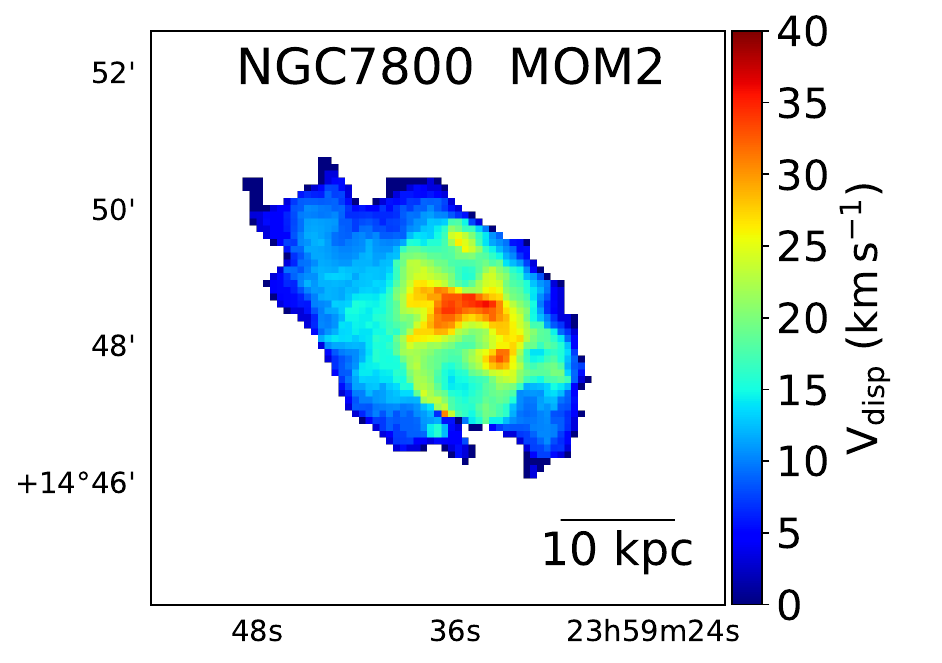
Figure 1: Moment maps of the galaxies. The first, second and the third columns of the images show the Moment zero, Moment one and Moment two maps, respectively. Moment zero maps: The contours of the images obtained from our analysis are plotted over the optical images of the respective galaxies. The contours represent the column density \( [1, 2, 4, 8, 16]\times10^{20} cm^{-2} \). The red patch at the bottom left corner represents the synthesised beam size and shape. Optical images of the galaxies are taken from The Digitized Sky Survey(DSS).